Immigrants from Nigeria vs African Master's Degree
COMPARE
Immigrants from Nigeria
African
Master's Degree
Master's Degree Comparison
Immigrants from Nigeria
Africans
14.6%
MASTER'S DEGREE
32.7/ 100
METRIC RATING
193rd/ 347
METRIC RANK
12.9%
MASTER'S DEGREE
1.4/ 100
METRIC RATING
248th/ 347
METRIC RANK
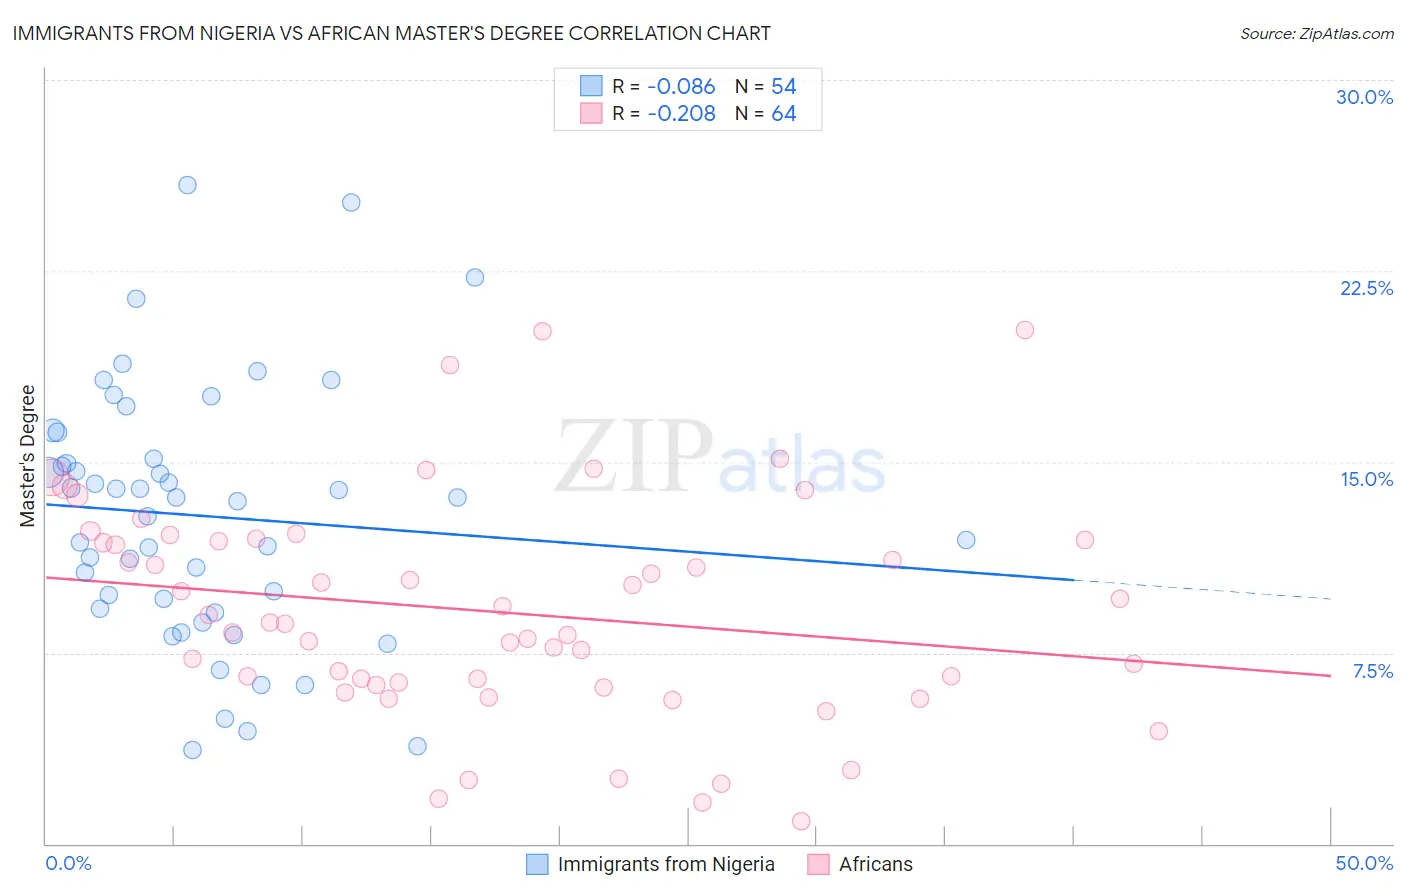
Immigrants from Nigeria vs African Master's Degree Correlation Chart
The statistical analysis conducted on geographies consisting of 283,420,581 people shows a slight negative correlation between the proportion of Immigrants from Nigeria and percentage of population with at least master's degree education in the United States with a correlation coefficient (R) of -0.086 and weighted average of 14.6%. Similarly, the statistical analysis conducted on geographies consisting of 469,751,464 people shows a weak negative correlation between the proportion of Africans and percentage of population with at least master's degree education in the United States with a correlation coefficient (R) of -0.208 and weighted average of 12.9%, a difference of 13.1%.
Master's Degree Correlation Summary
| Measurement | Immigrants from Nigeria | African |
| Minimum | 3.7% | 0.89% |
| Maximum | 25.9% | 20.2% |
| Range | 22.2% | 19.3% |
| Mean | 12.9% | 9.1% |
| Median | 13.5% | 8.6% |
| Interquartile 25% (IQ1) | 9.2% | 6.3% |
| Interquartile 75% (IQ3) | 15.1% | 11.9% |
| Interquartile Range (IQR) | 5.9% | 5.6% |
| Standard Deviation (Sample) | 5.0% | 4.3% |
| Standard Deviation (Population) | 5.0% | 4.2% |
Similar Demographics by Master's Degree
Demographics Similar to Immigrants from Nigeria by Master's Degree
In terms of master's degree, the demographic groups most similar to Immigrants from Nigeria are Chinese (14.6%, a difference of 0.040%), Immigrants from Middle Africa (14.6%, a difference of 0.13%), Welsh (14.6%, a difference of 0.22%), Danish (14.5%, a difference of 0.22%), and Czechoslovakian (14.5%, a difference of 0.43%).
| Demographics | Rating | Rank | Master's Degree |
| Immigrants | Oceania | 37.1 /100 | #186 | Fair 14.7% |
| Basques | 36.5 /100 | #187 | Fair 14.7% |
| Immigrants | Costa Rica | 36.2 /100 | #188 | Fair 14.7% |
| Immigrants | Immigrants | 36.0 /100 | #189 | Fair 14.6% |
| Spaniards | 35.8 /100 | #190 | Fair 14.6% |
| Welsh | 34.2 /100 | #191 | Fair 14.6% |
| Immigrants | Middle Africa | 33.6 /100 | #192 | Fair 14.6% |
| Immigrants | Nigeria | 32.7 /100 | #193 | Fair 14.6% |
| Chinese | 32.5 /100 | #194 | Fair 14.6% |
| Danes | 31.3 /100 | #195 | Fair 14.5% |
| Czechoslovakians | 29.9 /100 | #196 | Fair 14.5% |
| Belgians | 28.0 /100 | #197 | Fair 14.5% |
| West Indians | 27.4 /100 | #198 | Fair 14.5% |
| Immigrants | Armenia | 27.2 /100 | #199 | Fair 14.5% |
| Panamanians | 25.1 /100 | #200 | Fair 14.4% |
Demographics Similar to Africans by Master's Degree
In terms of master's degree, the demographic groups most similar to Africans are Iroquois (12.9%, a difference of 0.090%), Immigrants from Cambodia (12.9%, a difference of 0.12%), Immigrants from Bahamas (12.9%, a difference of 0.16%), Cree (12.8%, a difference of 0.31%), and Liberian (12.8%, a difference of 0.32%).
| Demographics | Rating | Rank | Master's Degree |
| U.S. Virgin Islanders | 2.1 /100 | #241 | Tragic 13.1% |
| Spanish Americans | 1.9 /100 | #242 | Tragic 13.0% |
| Immigrants | Jamaica | 1.9 /100 | #243 | Tragic 13.0% |
| Delaware | 1.7 /100 | #244 | Tragic 13.0% |
| Immigrants | Bahamas | 1.4 /100 | #245 | Tragic 12.9% |
| Immigrants | Cambodia | 1.4 /100 | #246 | Tragic 12.9% |
| Iroquois | 1.4 /100 | #247 | Tragic 12.9% |
| Africans | 1.4 /100 | #248 | Tragic 12.9% |
| Cree | 1.3 /100 | #249 | Tragic 12.8% |
| Liberians | 1.3 /100 | #250 | Tragic 12.8% |
| Tlingit-Haida | 1.3 /100 | #251 | Tragic 12.8% |
| French American Indians | 1.0 /100 | #252 | Tragic 12.7% |
| Immigrants | Dominica | 0.8 /100 | #253 | Tragic 12.6% |
| Indonesians | 0.8 /100 | #254 | Tragic 12.6% |
| Immigrants | Congo | 0.8 /100 | #255 | Tragic 12.6% |