Immigrants from Netherlands vs Sierra Leonean Unemployment Among Ages 45 to 54 years
COMPARE
Immigrants from Netherlands
Sierra Leonean
Unemployment Among Ages 45 to 54 years
Unemployment Among Ages 45 to 54 years Comparison
Immigrants from Netherlands
Sierra Leoneans
4.4%
UNEMPLOYMENT AMONG AGES 45 TO 54 YEARS
79.4/ 100
METRIC RATING
142nd/ 347
METRIC RANK
4.5%
UNEMPLOYMENT AMONG AGES 45 TO 54 YEARS
46.7/ 100
METRIC RATING
183rd/ 347
METRIC RANK
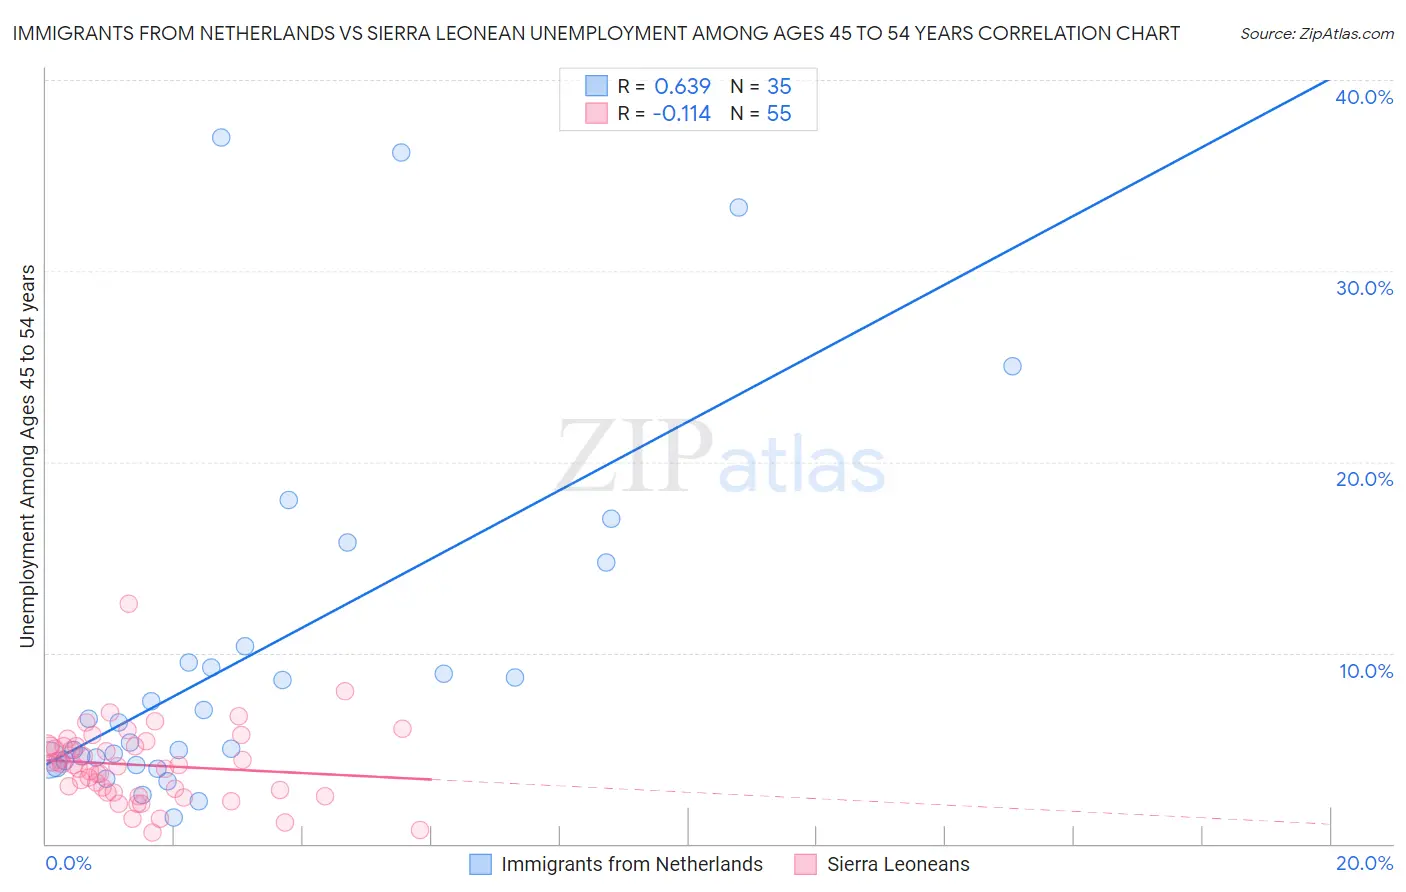
Immigrants from Netherlands vs Sierra Leonean Unemployment Among Ages 45 to 54 years Correlation Chart
The statistical analysis conducted on geographies consisting of 233,927,424 people shows a significant positive correlation between the proportion of Immigrants from Netherlands and unemployment rate among population between the ages 45 and 54 in the United States with a correlation coefficient (R) of 0.639 and weighted average of 4.4%. Similarly, the statistical analysis conducted on geographies consisting of 82,825,579 people shows a poor negative correlation between the proportion of Sierra Leoneans and unemployment rate among population between the ages 45 and 54 in the United States with a correlation coefficient (R) of -0.114 and weighted average of 4.5%, a difference of 1.8%.
Unemployment Among Ages 45 to 54 years Correlation Summary
| Measurement | Immigrants from Netherlands | Sierra Leonean |
| Minimum | 1.4% | 0.60% |
| Maximum | 37.0% | 12.6% |
| Range | 35.6% | 12.0% |
| Mean | 9.9% | 4.1% |
| Median | 6.3% | 4.1% |
| Interquartile 25% (IQ1) | 4.4% | 2.7% |
| Interquartile 75% (IQ3) | 10.3% | 5.1% |
| Interquartile Range (IQR) | 6.0% | 2.4% |
| Standard Deviation (Sample) | 9.4% | 2.0% |
| Standard Deviation (Population) | 9.3% | 2.0% |
Similar Demographics by Unemployment Among Ages 45 to 54 years
Demographics Similar to Immigrants from Netherlands by Unemployment Among Ages 45 to 54 years
In terms of unemployment among ages 45 to 54 years, the demographic groups most similar to Immigrants from Netherlands are Immigrants from Afghanistan (4.4%, a difference of 0.020%), Macedonian (4.5%, a difference of 0.030%), Immigrants from Zaire (4.4%, a difference of 0.10%), Taiwanese (4.5%, a difference of 0.11%), and Immigrants from Latvia (4.5%, a difference of 0.14%).
| Demographics | Rating | Rank | Unemployment Among Ages 45 to 54 years |
| Immigrants | Eastern Asia | 84.0 /100 | #135 | Excellent 4.4% |
| Immigrants | Middle Africa | 83.3 /100 | #136 | Excellent 4.4% |
| Lebanese | 81.9 /100 | #137 | Excellent 4.4% |
| Immigrants | Congo | 81.8 /100 | #138 | Excellent 4.4% |
| Immigrants | Kuwait | 81.7 /100 | #139 | Excellent 4.4% |
| Immigrants | Zaire | 80.7 /100 | #140 | Excellent 4.4% |
| Immigrants | Afghanistan | 79.6 /100 | #141 | Good 4.4% |
| Immigrants | Netherlands | 79.4 /100 | #142 | Good 4.4% |
| Macedonians | 79.0 /100 | #143 | Good 4.5% |
| Taiwanese | 77.9 /100 | #144 | Good 4.5% |
| Immigrants | Latvia | 77.5 /100 | #145 | Good 4.5% |
| Syrians | 77.3 /100 | #146 | Good 4.5% |
| Uruguayans | 76.9 /100 | #147 | Good 4.5% |
| Immigrants | Austria | 75.3 /100 | #148 | Good 4.5% |
| Costa Ricans | 75.3 /100 | #149 | Good 4.5% |
Demographics Similar to Sierra Leoneans by Unemployment Among Ages 45 to 54 years
In terms of unemployment among ages 45 to 54 years, the demographic groups most similar to Sierra Leoneans are Immigrants from China (4.5%, a difference of 0.0%), Immigrants from Poland (4.5%, a difference of 0.010%), Malaysian (4.5%, a difference of 0.040%), Immigrants from Hong Kong (4.5%, a difference of 0.040%), and Immigrants from Russia (4.5%, a difference of 0.070%).
| Demographics | Rating | Rank | Unemployment Among Ages 45 to 54 years |
| Puget Sound Salish | 49.1 /100 | #176 | Average 4.5% |
| Immigrants | Northern Africa | 49.0 /100 | #177 | Average 4.5% |
| Immigrants | Australia | 48.5 /100 | #178 | Average 4.5% |
| Immigrants | Russia | 48.2 /100 | #179 | Average 4.5% |
| Malaysians | 47.5 /100 | #180 | Average 4.5% |
| Immigrants | Poland | 47.0 /100 | #181 | Average 4.5% |
| Immigrants | China | 46.7 /100 | #182 | Average 4.5% |
| Sierra Leoneans | 46.7 /100 | #183 | Average 4.5% |
| Immigrants | Hong Kong | 45.9 /100 | #184 | Average 4.5% |
| Immigrants | Philippines | 41.0 /100 | #185 | Average 4.5% |
| Hawaiians | 39.1 /100 | #186 | Fair 4.5% |
| Immigrants | Ukraine | 36.8 /100 | #187 | Fair 4.5% |
| Immigrants | Sierra Leone | 36.3 /100 | #188 | Fair 4.6% |
| Immigrants | Laos | 35.7 /100 | #189 | Fair 4.6% |
| Immigrants | Serbia | 34.8 /100 | #190 | Fair 4.6% |