Immigrants from Netherlands vs Sierra Leonean 2nd Grade
COMPARE
Immigrants from Netherlands
Sierra Leonean
2nd Grade
2nd Grade Comparison
Immigrants from Netherlands
Sierra Leoneans
98.3%
2ND GRADE
99.4/ 100
METRIC RATING
74th/ 347
METRIC RANK
97.6%
2ND GRADE
4.3/ 100
METRIC RATING
223rd/ 347
METRIC RANK
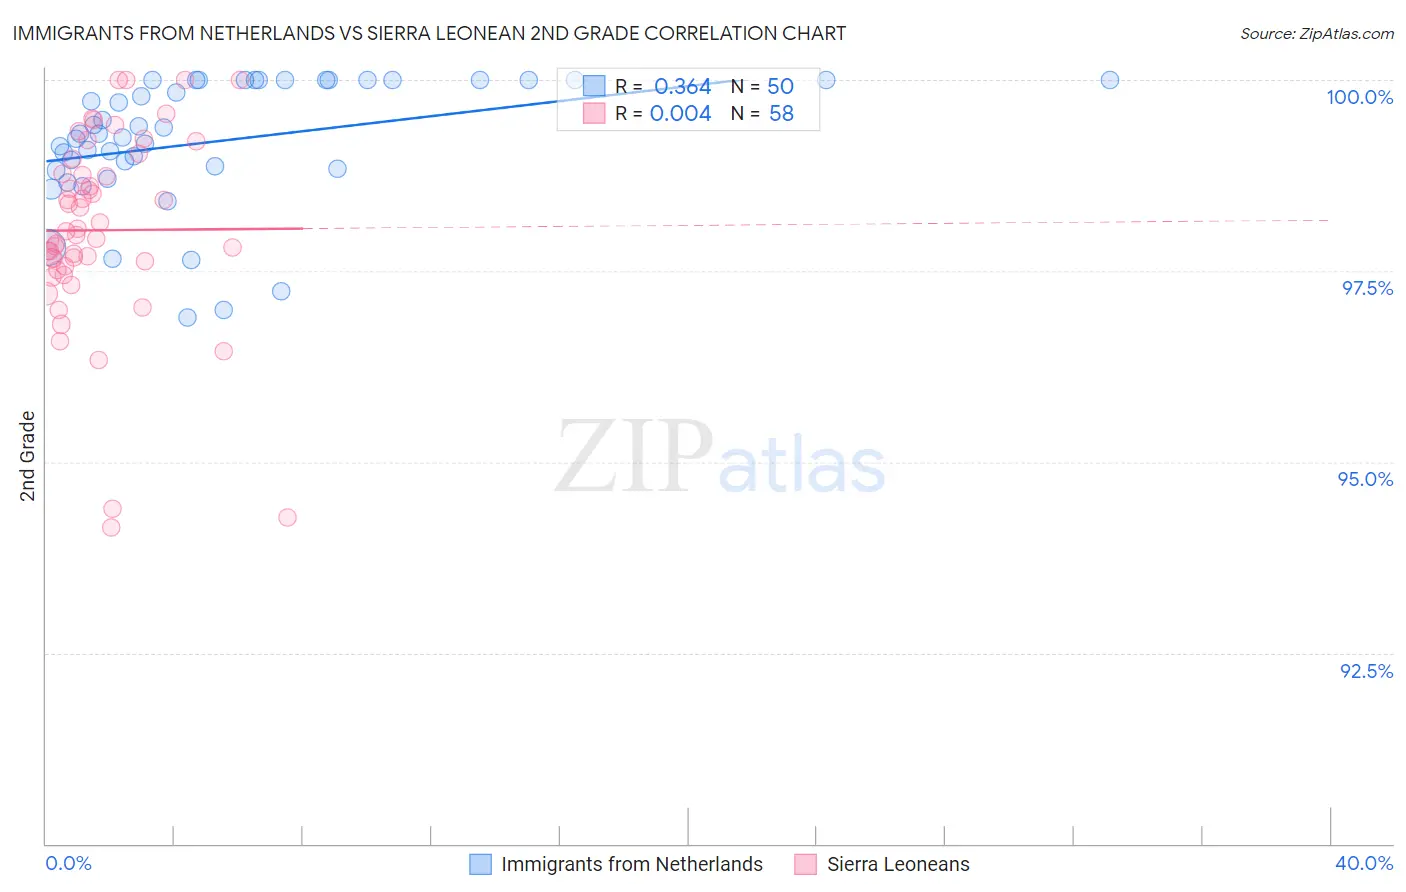
Immigrants from Netherlands vs Sierra Leonean 2nd Grade Correlation Chart
The statistical analysis conducted on geographies consisting of 237,869,934 people shows a mild positive correlation between the proportion of Immigrants from Netherlands and percentage of population with at least 2nd grade education in the United States with a correlation coefficient (R) of 0.364 and weighted average of 98.3%. Similarly, the statistical analysis conducted on geographies consisting of 83,337,655 people shows no correlation between the proportion of Sierra Leoneans and percentage of population with at least 2nd grade education in the United States with a correlation coefficient (R) of 0.004 and weighted average of 97.6%, a difference of 0.65%.
2nd Grade Correlation Summary
| Measurement | Immigrants from Netherlands | Sierra Leonean |
| Minimum | 96.9% | 94.1% |
| Maximum | 100.0% | 100.0% |
| Range | 3.1% | 5.9% |
| Mean | 99.2% | 98.0% |
| Median | 99.3% | 98.0% |
| Interquartile 25% (IQ1) | 98.8% | 97.6% |
| Interquartile 75% (IQ3) | 100.0% | 98.8% |
| Interquartile Range (IQR) | 1.2% | 1.2% |
| Standard Deviation (Sample) | 0.85% | 1.3% |
| Standard Deviation (Population) | 0.84% | 1.3% |
Similar Demographics by 2nd Grade
Demographics Similar to Immigrants from Netherlands by 2nd Grade
In terms of 2nd grade, the demographic groups most similar to Immigrants from Netherlands are Shoshone (98.3%, a difference of 0.010%), Cherokee (98.3%, a difference of 0.010%), Immigrants from England (98.3%, a difference of 0.010%), Cheyenne (98.3%, a difference of 0.020%), and Cajun (98.3%, a difference of 0.020%).
| Demographics | Rating | Rank | 2nd Grade |
| Immigrants | Northern Europe | 99.7 /100 | #67 | Exceptional 98.3% |
| Russians | 99.7 /100 | #68 | Exceptional 98.3% |
| Immigrants | Austria | 99.6 /100 | #69 | Exceptional 98.3% |
| Serbians | 99.6 /100 | #70 | Exceptional 98.3% |
| Chickasaw | 99.6 /100 | #71 | Exceptional 98.3% |
| Cheyenne | 99.6 /100 | #72 | Exceptional 98.3% |
| Cajuns | 99.5 /100 | #73 | Exceptional 98.3% |
| Immigrants | Netherlands | 99.4 /100 | #74 | Exceptional 98.3% |
| Shoshone | 99.4 /100 | #75 | Exceptional 98.3% |
| Cherokee | 99.4 /100 | #76 | Exceptional 98.3% |
| Immigrants | England | 99.4 /100 | #77 | Exceptional 98.3% |
| Immigrants | Lithuania | 99.3 /100 | #78 | Exceptional 98.2% |
| Immigrants | Belgium | 99.3 /100 | #79 | Exceptional 98.2% |
| Osage | 99.2 /100 | #80 | Exceptional 98.2% |
| Icelanders | 99.2 /100 | #81 | Exceptional 98.2% |
Demographics Similar to Sierra Leoneans by 2nd Grade
In terms of 2nd grade, the demographic groups most similar to Sierra Leoneans are Immigrants from Sudan (97.6%, a difference of 0.0%), Immigrants from Zaire (97.6%, a difference of 0.0%), Tongan (97.6%, a difference of 0.0%), Immigrants from Morocco (97.6%, a difference of 0.010%), and Iraqi (97.6%, a difference of 0.010%).
| Demographics | Rating | Rank | 2nd Grade |
| South American Indians | 6.7 /100 | #216 | Tragic 97.7% |
| Uruguayans | 6.2 /100 | #217 | Tragic 97.7% |
| Sudanese | 5.7 /100 | #218 | Tragic 97.7% |
| Immigrants | Panama | 5.1 /100 | #219 | Tragic 97.6% |
| Immigrants | Morocco | 5.0 /100 | #220 | Tragic 97.6% |
| Iraqis | 4.6 /100 | #221 | Tragic 97.6% |
| Immigrants | Sudan | 4.5 /100 | #222 | Tragic 97.6% |
| Sierra Leoneans | 4.3 /100 | #223 | Tragic 97.6% |
| Immigrants | Zaire | 4.3 /100 | #224 | Tragic 97.6% |
| Tongans | 4.3 /100 | #225 | Tragic 97.6% |
| Immigrants | Syria | 4.0 /100 | #226 | Tragic 97.6% |
| Immigrants | Nepal | 4.0 /100 | #227 | Tragic 97.6% |
| Sub-Saharan Africans | 3.4 /100 | #228 | Tragic 97.6% |
| Immigrants | Costa Rica | 3.1 /100 | #229 | Tragic 97.6% |
| Senegalese | 3.1 /100 | #230 | Tragic 97.6% |