Immigrants from Netherlands vs Yaqui Poverty
COMPARE
Immigrants from Netherlands
Yaqui
Poverty
Poverty Comparison
Immigrants from Netherlands
Yaqui
11.2%
POVERTY
97.5/ 100
METRIC RATING
66th/ 347
METRIC RANK
15.1%
POVERTY
0.0/ 100
METRIC RATING
288th/ 347
METRIC RANK
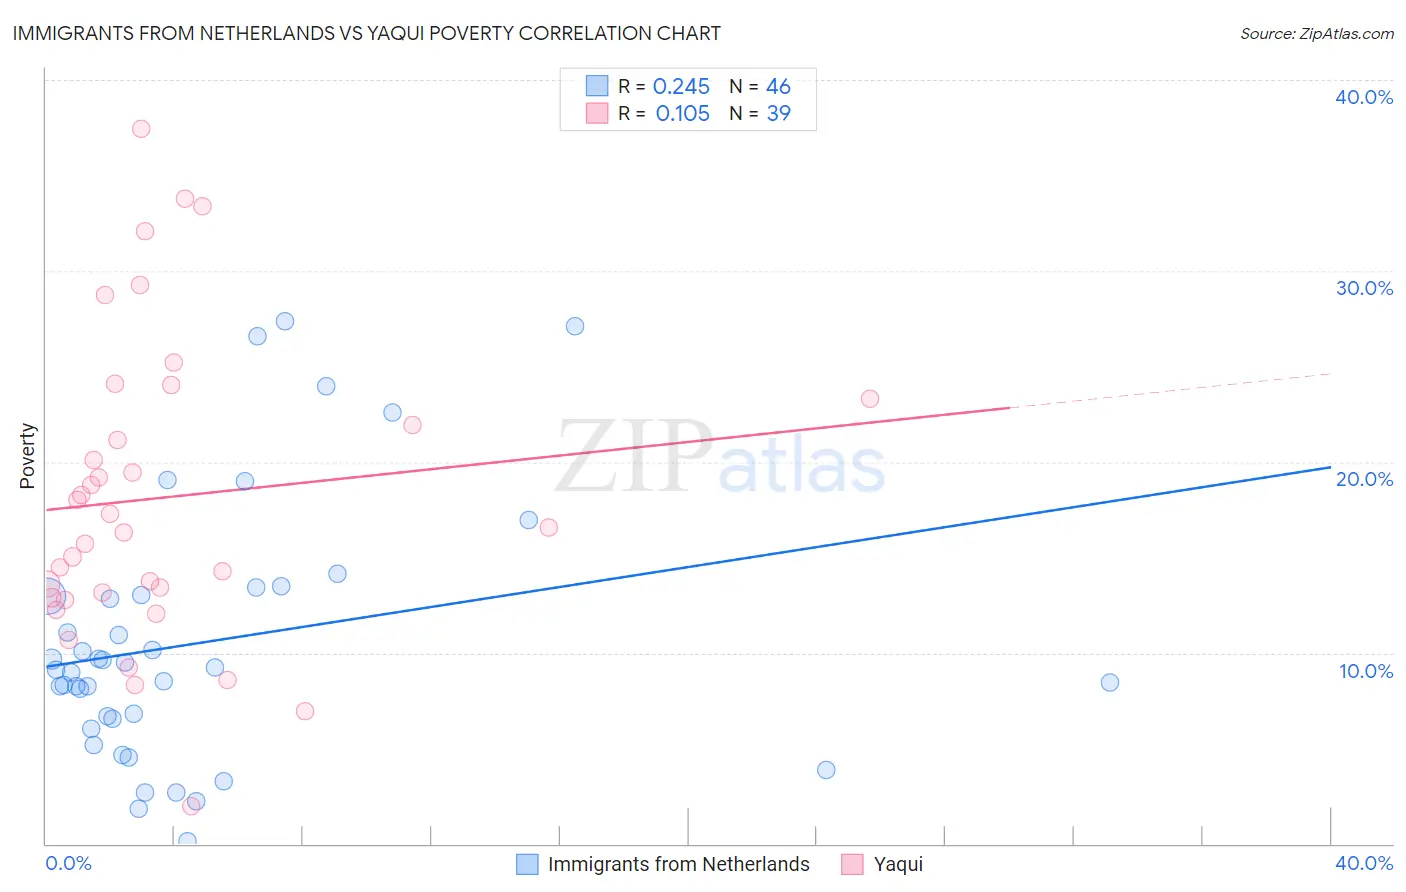
Immigrants from Netherlands vs Yaqui Poverty Correlation Chart
The statistical analysis conducted on geographies consisting of 237,819,327 people shows a weak positive correlation between the proportion of Immigrants from Netherlands and poverty level in the United States with a correlation coefficient (R) of 0.245 and weighted average of 11.2%. Similarly, the statistical analysis conducted on geographies consisting of 107,716,749 people shows a poor positive correlation between the proportion of Yaqui and poverty level in the United States with a correlation coefficient (R) of 0.105 and weighted average of 15.1%, a difference of 34.2%.
Poverty Correlation Summary
| Measurement | Immigrants from Netherlands | Yaqui |
| Minimum | 0.13% | 2.0% |
| Maximum | 27.4% | 37.5% |
| Range | 27.2% | 35.5% |
| Mean | 10.6% | 18.1% |
| Median | 9.2% | 16.6% |
| Interquartile 25% (IQ1) | 6.6% | 12.9% |
| Interquartile 75% (IQ3) | 13.0% | 23.3% |
| Interquartile Range (IQR) | 6.4% | 10.4% |
| Standard Deviation (Sample) | 6.8% | 8.0% |
| Standard Deviation (Population) | 6.7% | 7.9% |
Similar Demographics by Poverty
Demographics Similar to Immigrants from Netherlands by Poverty
In terms of poverty, the demographic groups most similar to Immigrants from Netherlands are Immigrants from Australia (11.2%, a difference of 0.040%), Slovak (11.2%, a difference of 0.060%), Immigrants from Asia (11.2%, a difference of 0.070%), Serbian (11.2%, a difference of 0.12%), and Swiss (11.2%, a difference of 0.20%).
| Demographics | Rating | Rank | Poverty |
| Immigrants | Europe | 98.0 /100 | #59 | Exceptional 11.2% |
| Immigrants | Sri Lanka | 97.9 /100 | #60 | Exceptional 11.2% |
| Immigrants | Italy | 97.9 /100 | #61 | Exceptional 11.2% |
| Austrians | 97.8 /100 | #62 | Exceptional 11.2% |
| Ukrainians | 97.8 /100 | #63 | Exceptional 11.2% |
| Swiss | 97.7 /100 | #64 | Exceptional 11.2% |
| Immigrants | Asia | 97.5 /100 | #65 | Exceptional 11.2% |
| Immigrants | Netherlands | 97.5 /100 | #66 | Exceptional 11.2% |
| Immigrants | Australia | 97.4 /100 | #67 | Exceptional 11.2% |
| Slovaks | 97.4 /100 | #68 | Exceptional 11.2% |
| Serbians | 97.4 /100 | #69 | Exceptional 11.2% |
| Immigrants | Canada | 97.3 /100 | #70 | Exceptional 11.3% |
| Zimbabweans | 97.3 /100 | #71 | Exceptional 11.3% |
| Europeans | 97.2 /100 | #72 | Exceptional 11.3% |
| Immigrants | Belgium | 97.2 /100 | #73 | Exceptional 11.3% |
Demographics Similar to Yaqui by Poverty
In terms of poverty, the demographic groups most similar to Yaqui are Inupiat (15.1%, a difference of 0.010%), Immigrants from Belize (15.1%, a difference of 0.12%), Immigrants from Latin America (15.0%, a difference of 0.22%), Mexican (15.1%, a difference of 0.22%), and Immigrants from Cabo Verde (15.1%, a difference of 0.35%).
| Demographics | Rating | Rank | Poverty |
| Immigrants | Barbados | 0.0 /100 | #281 | Tragic 14.9% |
| Comanche | 0.0 /100 | #282 | Tragic 15.0% |
| Immigrants | Haiti | 0.0 /100 | #283 | Tragic 15.0% |
| West Indians | 0.0 /100 | #284 | Tragic 15.0% |
| Vietnamese | 0.0 /100 | #285 | Tragic 15.0% |
| Immigrants | Latin America | 0.0 /100 | #286 | Tragic 15.0% |
| Inupiat | 0.0 /100 | #287 | Tragic 15.1% |
| Yaqui | 0.0 /100 | #288 | Tragic 15.1% |
| Immigrants | Belize | 0.0 /100 | #289 | Tragic 15.1% |
| Mexicans | 0.0 /100 | #290 | Tragic 15.1% |
| Immigrants | Cabo Verde | 0.0 /100 | #291 | Tragic 15.1% |
| Indonesians | 0.0 /100 | #292 | Tragic 15.1% |
| Immigrants | Zaire | 0.0 /100 | #293 | Tragic 15.1% |
| Blackfeet | 0.0 /100 | #294 | Tragic 15.2% |
| Guatemalans | 0.0 /100 | #295 | Tragic 15.3% |