Immigrants from Morocco vs French Canadian Child Poverty Among Boys Under 16
COMPARE
Immigrants from Morocco
French Canadian
Child Poverty Among Boys Under 16
Child Poverty Among Boys Under 16 Comparison
Immigrants from Morocco
French Canadians
16.7%
CHILD POVERTY AMONG BOYS UNDER 16
34.5/ 100
METRIC RATING
189th/ 347
METRIC RANK
15.9%
CHILD POVERTY AMONG BOYS UNDER 16
76.6/ 100
METRIC RATING
155th/ 347
METRIC RANK
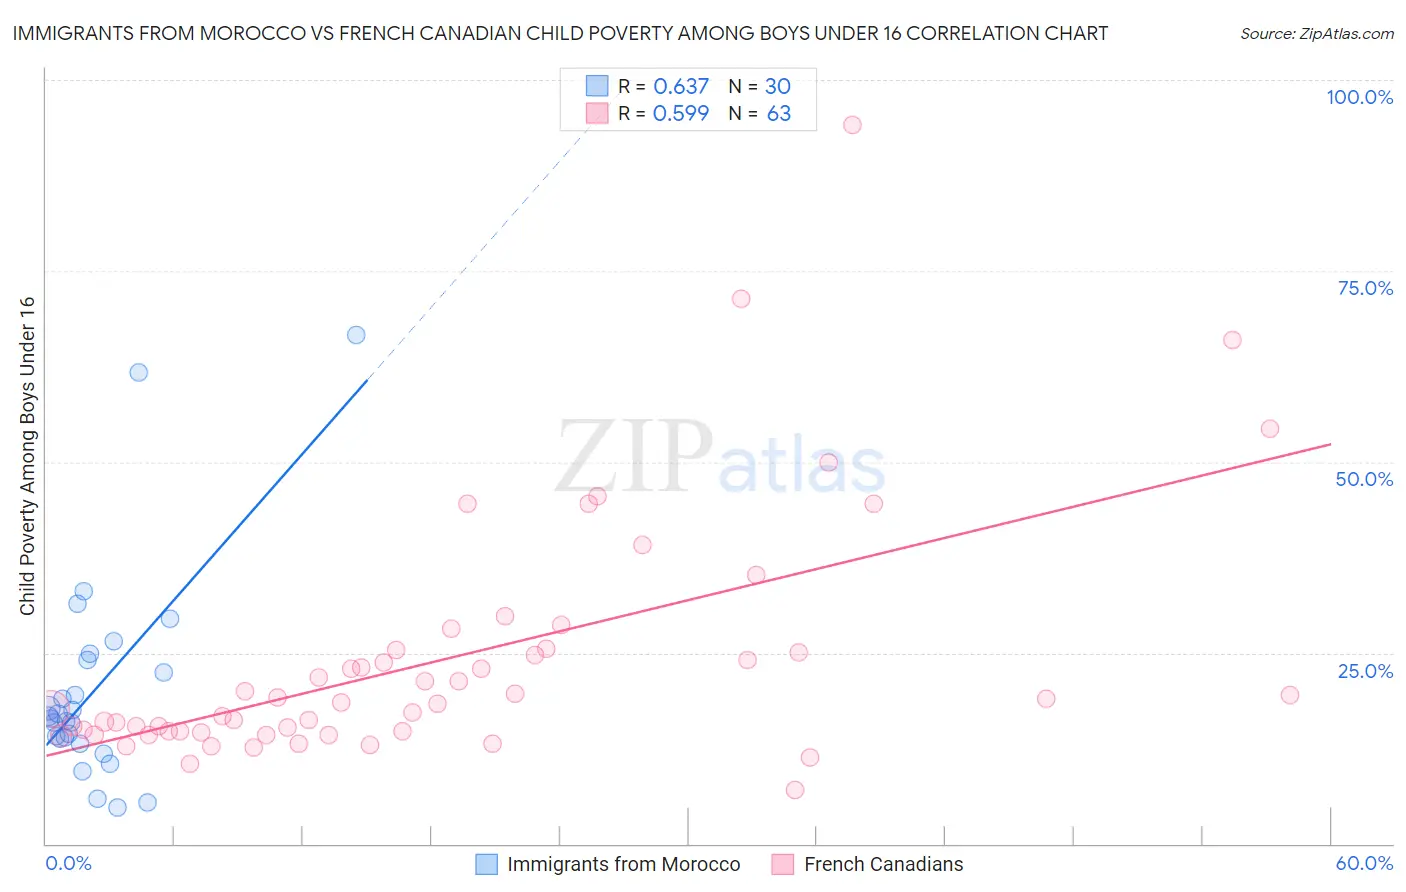
Immigrants from Morocco vs French Canadian Child Poverty Among Boys Under 16 Correlation Chart
The statistical analysis conducted on geographies consisting of 177,812,919 people shows a significant positive correlation between the proportion of Immigrants from Morocco and poverty level among boys under the age of 16 in the United States with a correlation coefficient (R) of 0.637 and weighted average of 16.7%. Similarly, the statistical analysis conducted on geographies consisting of 488,484,984 people shows a substantial positive correlation between the proportion of French Canadians and poverty level among boys under the age of 16 in the United States with a correlation coefficient (R) of 0.599 and weighted average of 15.9%, a difference of 5.3%.
Child Poverty Among Boys Under 16 Correlation Summary
| Measurement | Immigrants from Morocco | French Canadian |
| Minimum | 4.7% | 7.1% |
| Maximum | 66.7% | 94.2% |
| Range | 61.9% | 87.1% |
| Mean | 20.3% | 24.1% |
| Median | 16.5% | 18.5% |
| Interquartile 25% (IQ1) | 13.8% | 14.7% |
| Interquartile 75% (IQ3) | 24.0% | 25.4% |
| Interquartile Range (IQR) | 10.3% | 10.6% |
| Standard Deviation (Sample) | 13.9% | 16.0% |
| Standard Deviation (Population) | 13.7% | 15.9% |
Similar Demographics by Child Poverty Among Boys Under 16
Demographics Similar to Immigrants from Morocco by Child Poverty Among Boys Under 16
In terms of child poverty among boys under 16, the demographic groups most similar to Immigrants from Morocco are Immigrants from Costa Rica (16.7%, a difference of 0.39%), Immigrants from South America (16.7%, a difference of 0.39%), Arab (16.8%, a difference of 0.42%), Hmong (16.6%, a difference of 0.47%), and Alaska Native (16.8%, a difference of 0.59%).
| Demographics | Rating | Rank | Child Poverty Among Boys Under 16 |
| Lebanese | 43.3 /100 | #182 | Average 16.6% |
| Kenyans | 41.0 /100 | #183 | Average 16.6% |
| Celtics | 40.6 /100 | #184 | Average 16.6% |
| Immigrants | Western Asia | 40.4 /100 | #185 | Average 16.6% |
| Hmong | 38.4 /100 | #186 | Fair 16.6% |
| Immigrants | Costa Rica | 37.8 /100 | #187 | Fair 16.7% |
| Immigrants | South America | 37.7 /100 | #188 | Fair 16.7% |
| Immigrants | Morocco | 34.5 /100 | #189 | Fair 16.7% |
| Arabs | 31.1 /100 | #190 | Fair 16.8% |
| Alaska Natives | 29.8 /100 | #191 | Fair 16.8% |
| Immigrants | Uganda | 21.6 /100 | #192 | Fair 17.0% |
| Immigrants | Iraq | 21.6 /100 | #193 | Fair 17.0% |
| Immigrants | Lebanon | 21.2 /100 | #194 | Fair 17.0% |
| Spanish | 20.8 /100 | #195 | Fair 17.0% |
| Spaniards | 20.5 /100 | #196 | Fair 17.1% |
Demographics Similar to French Canadians by Child Poverty Among Boys Under 16
In terms of child poverty among boys under 16, the demographic groups most similar to French Canadians are Israeli (15.9%, a difference of 0.010%), Immigrants from Nepal (15.9%, a difference of 0.10%), Yugoslavian (15.9%, a difference of 0.11%), Syrian (15.9%, a difference of 0.15%), and Immigrants from Chile (15.9%, a difference of 0.28%).
| Demographics | Rating | Rank | Child Poverty Among Boys Under 16 |
| Brazilians | 81.0 /100 | #148 | Excellent 15.8% |
| Slovaks | 80.3 /100 | #149 | Excellent 15.8% |
| Immigrants | Jordan | 80.2 /100 | #150 | Excellent 15.8% |
| Puget Sound Salish | 79.8 /100 | #151 | Good 15.8% |
| Immigrants | Venezuela | 79.5 /100 | #152 | Good 15.8% |
| French | 78.7 /100 | #153 | Good 15.8% |
| Syrians | 77.5 /100 | #154 | Good 15.9% |
| French Canadians | 76.6 /100 | #155 | Good 15.9% |
| Israelis | 76.5 /100 | #156 | Good 15.9% |
| Immigrants | Nepal | 76.0 /100 | #157 | Good 15.9% |
| Yugoslavians | 75.9 /100 | #158 | Good 15.9% |
| Immigrants | Chile | 74.8 /100 | #159 | Good 15.9% |
| Immigrants | Northern Africa | 71.3 /100 | #160 | Good 16.0% |
| Immigrants | Oceania | 71.3 /100 | #161 | Good 16.0% |
| Guamanians/Chamorros | 69.6 /100 | #162 | Good 16.1% |