Immigrants from Morocco vs Immigrants from Belarus Child Poverty Among Boys Under 16

COMPARE

Immigrants from Morocco
Race
Ancestry
AfghanAfricanAlaska NativeAlaskan AthabascanAlbanianAleutAlsatianAmericanApacheArabArapahoArgentineanArmenianAssyrian/Chaldean/SyriacAustralianAustrianBahamianBangladeshiBarbadianBasqueBelgianBelizeanBermudanBhutaneseBlackfeetBolivianBrazilianBritishBritish West IndianBulgarianBurmeseCajunCambodianCanadianCape VerdeanCarpatho RusynCelticCentral AmericanCentral American IndianCherokeeCheyenneChickasawChileanChineseChippewaChoctawColombianColvilleComancheCosta RicanCreeCreekCroatianCrowCubanCypriotCzechCzechoslovakianDanishDelawareDominicanDutchDutch West IndianEastern EuropeanEcuadorianEgyptianEnglishEstonianEthiopianEuropeanFijianFilipinoFinnishFrenchFrench American IndianFrench CanadianGermanGerman RussianGhanaianGreekGuamanian/ChamorroGuatemalanGuyaneseHaitianHmongHonduranHopiHoumaHungarianIcelanderIndian (Asian)IndonesianInupiatIranianIraqiIrishIroquoisIsraeliItalianJamaicanJapaneseJordanianKenyanKiowaKoreanLaotianLatvianLebaneseLiberianLithuanianLumbeeLuxembourgerMacedonianMalaysianMalteseMarshalleseMenomineeMexicanMexican American IndianMongolianMoroccanNative HawaiianNavajoNepaleseNew ZealanderNicaraguanNigerianNorthern EuropeanNorwegianOkinawanOsageOttawaPaiutePakistaniPalestinianPanamanianParaguayanPennsylvania GermanPeruvianPimaPolishPortuguesePotawatomiPuebloPuerto RicanPuget Sound SalishRomanianRussianSalvadoranSamoanScandinavianScotch-IrishScottishSeminoleSenegaleseSerbianShoshoneSierra LeoneanSiouxSlavicSlovakSloveneSomaliSouth AfricanSouth AmericanSouth American IndianSoviet UnionSpaniardSpanishSpanish AmericanSpanish American IndianSri LankanSubsaharan AfricanSudaneseSwedishSwissSyrianTaiwaneseThaiTlingit-HaidaTohono O'OdhamTonganTrinidadian and TobagonianTsimshianTurkishU.S. Virgin IslanderUgandanUkrainianUruguayanUteVenezuelanVietnameseWelshWest IndianYakamaYaquiYugoslavianYumanYup'ikZimbabwean
Immigration
NonimmigrantsImmigrantsAfghanistanAfricaAlbaniaArgentinaArmeniaAsiaAustraliaAustriaBahamasBangladeshBarbadosBelgiumBelizeBoliviaBosnia and HerzegovinaBrazilBulgariaBurma/MyanmarCabo VerdeCambodiaCameroonCanadaCaribbeanCentral AmericaChileChinaColombiaCongoCosta RicaCroatiaCubaCzechoslovakiaDenmarkDominicaDominican RepublicEastern AfricaEastern AsiaEastern EuropeEcuadorEgyptEl SalvadorEnglandEritreaEthiopiaEuropeFijiFranceGermanyGhanaGreeceGrenadaGuatemalaGuyanaHaitiHondurasHong KongHungaryIndiaIndonesiaIranIraqIrelandIsraelItalyJamaicaJapanJordanKazakhstanKenyaKoreaKuwaitLaosLatin AmericaLatviaLebanonLiberiaLithuaniaMalaysiaMexicoMicronesiaMiddle AfricaMoldovaMoroccoNepalNetherlandsNicaraguaNigeriaNorth AmericaNorth MacedoniaNorthern AfricaNorthern EuropeNorwayOceaniaPakistanPanamaPeruPhilippinesPolandPortugalRomaniaRussiaSaudi ArabiaScotlandSenegalSerbiaSierra LeoneSingaporeSomaliaSouth AfricaSouth AmericaSouth Central AsiaSouth Eastern AsiaSouthern EuropeSpainSri LankaSt. Vincent and the GrenadinesSudanSwedenSwitzerlandSyriaTaiwanThailandTrinidad and TobagoTurkeyUgandaUkraineUruguayUzbekistanVenezuelaVietnamWest IndiesWestern AfricaWestern AsiaWestern EuropeYemenZaireZimbabweAzores
Immigrants from Belarus
Race
Ancestry
AfghanAfricanAlaska NativeAlaskan AthabascanAlbanianAleutAlsatianAmericanApacheArabArapahoArgentineanArmenianAssyrian/Chaldean/SyriacAustralianAustrianBahamianBangladeshiBarbadianBasqueBelgianBelizeanBermudanBhutaneseBlackfeetBolivianBrazilianBritishBritish West IndianBulgarianBurmeseCajunCambodianCanadianCape VerdeanCarpatho RusynCelticCentral AmericanCentral American IndianCherokeeCheyenneChickasawChileanChineseChippewaChoctawColombianColvilleComancheCosta RicanCreeCreekCroatianCrowCubanCypriotCzechCzechoslovakianDanishDelawareDominicanDutchDutch West IndianEastern EuropeanEcuadorianEgyptianEnglishEstonianEthiopianEuropeanFijianFilipinoFinnishFrenchFrench American IndianFrench CanadianGermanGerman RussianGhanaianGreekGuamanian/ChamorroGuatemalanGuyaneseHaitianHmongHonduranHopiHoumaHungarianIcelanderIndian (Asian)IndonesianInupiatIranianIraqiIrishIroquoisIsraeliItalianJamaicanJapaneseJordanianKenyanKiowaKoreanLaotianLatvianLebaneseLiberianLithuanianLumbeeLuxembourgerMacedonianMalaysianMalteseMarshalleseMenomineeMexicanMexican American IndianMongolianMoroccanNative HawaiianNavajoNepaleseNew ZealanderNicaraguanNigerianNorthern EuropeanNorwegianOkinawanOsageOttawaPaiutePakistaniPalestinianPanamanianParaguayanPennsylvania GermanPeruvianPimaPolishPortuguesePotawatomiPuebloPuerto RicanPuget Sound SalishRomanianRussianSalvadoranSamoanScandinavianScotch-IrishScottishSeminoleSenegaleseSerbianShoshoneSierra LeoneanSiouxSlavicSlovakSloveneSomaliSouth AfricanSouth AmericanSouth American IndianSoviet UnionSpaniardSpanishSpanish AmericanSpanish American IndianSri LankanSubsaharan AfricanSudaneseSwedishSwissSyrianTaiwaneseThaiTlingit-HaidaTohono O'OdhamTonganTrinidadian and TobagonianTsimshianTurkishU.S. Virgin IslanderUgandanUkrainianUruguayanUteVenezuelanVietnameseWelshWest IndianYakamaYaquiYugoslavianYumanYup'ikZimbabwean
Immigration
NonimmigrantsImmigrantsAfghanistanAfricaAlbaniaArgentinaArmeniaAsiaAustraliaAustriaBahamasBangladeshBarbadosBelarusBelgiumBelizeBoliviaBosnia and HerzegovinaBrazilBulgariaBurma/MyanmarCabo VerdeCambodiaCameroonCanadaCaribbeanCentral AmericaChileChinaColombiaCongoCosta RicaCroatiaCubaCzechoslovakiaDenmarkDominicaDominican RepublicEastern AfricaEastern AsiaEastern EuropeEcuadorEgyptEl SalvadorEnglandEritreaEthiopiaEuropeFijiFranceGermanyGhanaGreeceGrenadaGuatemalaGuyanaHaitiHondurasHong KongHungaryIndiaIndonesiaIranIraqIrelandIsraelItalyJamaicaJapanJordanKazakhstanKenyaKoreaKuwaitLaosLatin AmericaLatviaLebanonLiberiaLithuaniaMalaysiaMexicoMicronesiaMiddle AfricaMoldovaNepalNetherlandsNicaraguaNigeriaNorth AmericaNorth MacedoniaNorthern AfricaNorthern EuropeNorwayOceaniaPakistanPanamaPeruPhilippinesPolandPortugalRomaniaRussiaSaudi ArabiaScotlandSenegalSerbiaSierra LeoneSingaporeSomaliaSouth AfricaSouth AmericaSouth Central AsiaSouth Eastern AsiaSouthern EuropeSpainSri LankaSt. Vincent and the GrenadinesSudanSwedenSwitzerlandSyriaTaiwanThailandTrinidad and TobagoTurkeyUgandaUkraineUruguayUzbekistanVenezuelaVietnamWest IndiesWestern AfricaWestern AsiaWestern EuropeYemenZaireZimbabweAzores
Child Poverty Among Boys Under 16
Income
Poverty
Unemployment
Labor Participation
Family Structure
Vehicle Availability
Education Level
Disability

Child Poverty Among Boys Under 16 Comparison

Immigrants from Morocco

Immigrants from Belarus

Fair
Exceptional
16.7%
CHILD POVERTY AMONG BOYS UNDER 16
34.5/ 100
METRIC RATING
189th/ 347
METRIC RANK
15.0%
CHILD POVERTY AMONG BOYS UNDER 16
95.7/ 100
METRIC RATING
101st/ 347
METRIC RANK

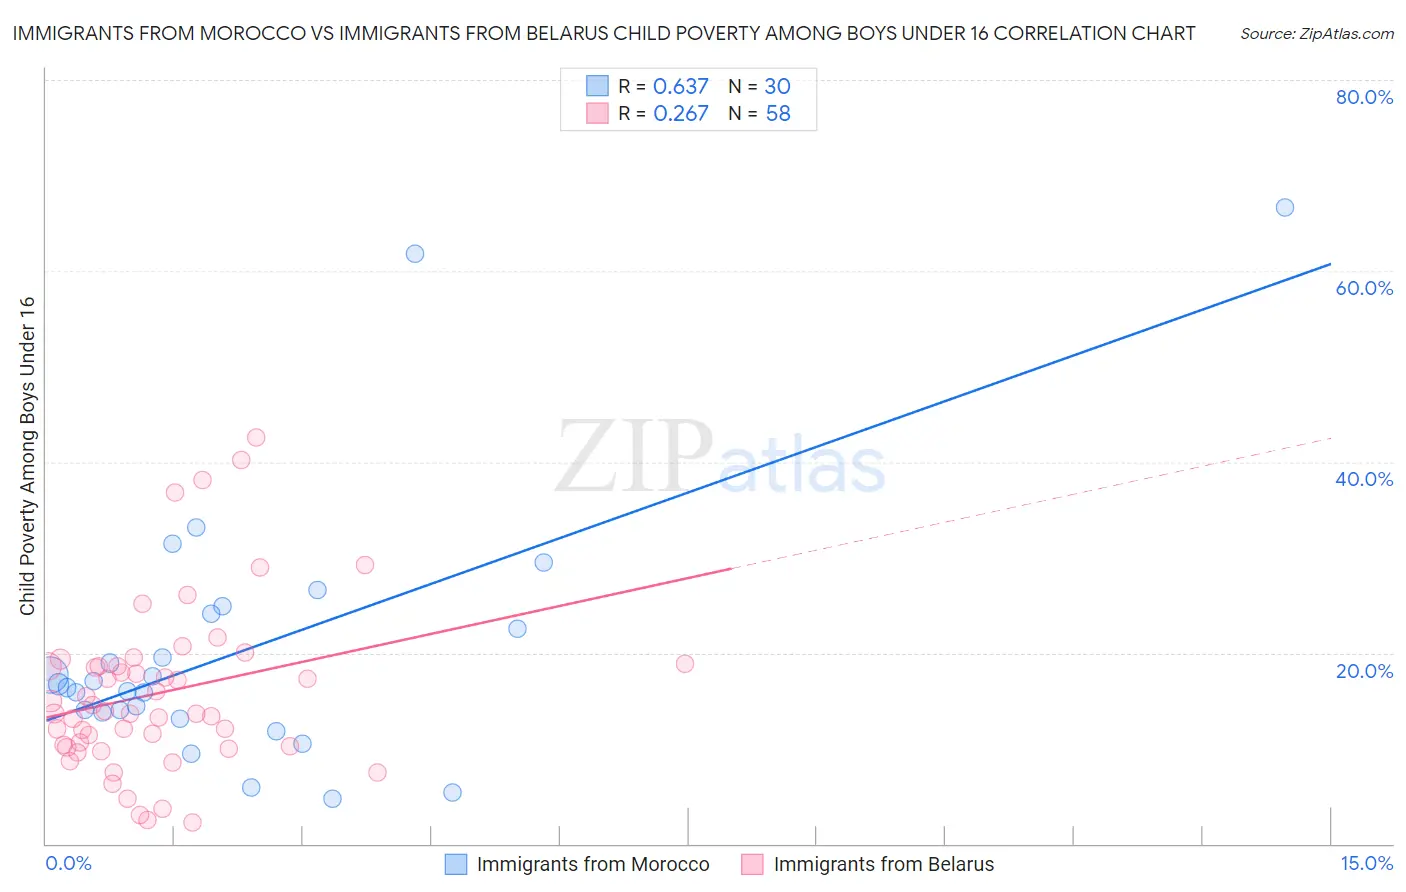
Immigrants from Morocco vs Immigrants from Belarus Child Poverty Among Boys Under 16 Correlation Chart

The statistical analysis conducted on geographies consisting of 177,812,919 people shows a significant positive correlation between the proportion of Immigrants from Morocco and poverty level among boys under the age of 16 in the United States with a correlation coefficient (R) of 0.637 and weighted average of 16.7%. Similarly, the statistical analysis conducted on geographies consisting of 148,931,301 people shows a weak positive correlation between the proportion of Immigrants from Belarus and poverty level among boys under the age of 16 in the United States with a correlation coefficient (R) of 0.267 and weighted average of 15.0%, a difference of 11.5%.
Immigrants from Morocco vs Immigrants from Belarus Child Poverty Among Boys Under 16

Child Poverty Among Boys Under 16 Correlation Summary

MeasurementImmigrants from MoroccoImmigrants from Belarus
Minimum4.7%2.2%
Maximum66.7%42.5%
Range61.9%40.4%
Mean20.3%15.8%
Median16.5%13.7%
Interquartile 25% (IQ1)13.8%10.2%
Interquartile 75% (IQ3)24.0%18.6%
Interquartile Range (IQR)10.3%8.4%
Standard Deviation (Sample)13.9%8.8%
Standard Deviation (Population)13.7%8.8%

Similar Demographics by Child Poverty Among Boys Under 16

Demographics Similar to Immigrants from Morocco by Child Poverty Among Boys Under 16

In terms of child poverty among boys under 16, the demographic groups most similar to Immigrants from Morocco are Immigrants from Costa Rica (16.7%, a difference of 0.39%), Immigrants from South America (16.7%, a difference of 0.39%), Arab (16.8%, a difference of 0.42%), Hmong (16.6%, a difference of 0.47%), and Alaska Native (16.8%, a difference of 0.59%).
DemographicsRating | RankChild Poverty Among Boys Under 16
Lebanese
43.3
/100
|
#182
Average
16.6%
Kenyans
41.0
/100
|
#183
Average
16.6%
Celtics
40.6
/100
|
#184
Average
16.6%
Immigrants | Western Asia
40.4
/100
|
#185
Average
16.6%
Hmong
38.4
/100
|
#186
Fair
16.6%
Immigrants | Costa Rica
37.8
/100
|
#187
Fair
16.7%
Immigrants | South America
37.7
/100
|
#188
Fair
16.7%
Immigrants | Morocco
34.5
/100
|
#189
Fair
16.7%
Arabs
31.1
/100
|
#190
Fair
16.8%
Alaska Natives
29.8
/100
|
#191
Fair
16.8%
Immigrants | Uganda
21.6
/100
|
#192
Fair
17.0%
Immigrants | Iraq
21.6
/100
|
#193
Fair
17.0%
Immigrants | Lebanon
21.2
/100
|
#194
Fair
17.0%
Spanish
20.8
/100
|
#195
Fair
17.0%
Spaniards
20.5
/100
|
#196
Fair
17.1%

Demographics Similar to Immigrants from Belarus by Child Poverty Among Boys Under 16

In terms of child poverty among boys under 16, the demographic groups most similar to Immigrants from Belarus are Chilean (15.0%, a difference of 0.050%), Romanian (15.0%, a difference of 0.070%), Immigrants from Denmark (15.0%, a difference of 0.11%), Immigrants from Switzerland (15.0%, a difference of 0.21%), and Dutch (15.0%, a difference of 0.22%).
DemographicsRating | RankChild Poverty Among Boys Under 16
Immigrants | Italy
96.7
/100
|
#94
Exceptional
14.9%
Finns
96.5
/100
|
#95
Exceptional
14.9%
Immigrants | North Macedonia
96.3
/100
|
#96
Exceptional
14.9%
Immigrants | Egypt
96.2
/100
|
#97
Exceptional
14.9%
British
96.2
/100
|
#98
Exceptional
15.0%
Immigrants | France
96.1
/100
|
#99
Exceptional
15.0%
Chileans
95.8
/100
|
#100
Exceptional
15.0%
Immigrants | Belarus
95.7
/100
|
#101
Exceptional
15.0%
Romanians
95.6
/100
|
#102
Exceptional
15.0%
Immigrants | Denmark
95.6
/100
|
#103
Exceptional
15.0%
Immigrants | Switzerland
95.4
/100
|
#104
Exceptional
15.0%
Dutch
95.4
/100
|
#105
Exceptional
15.0%
Serbians
95.2
/100
|
#106
Exceptional
15.1%
Jordanians
95.1
/100
|
#107
Exceptional
15.1%
Immigrants | England
94.8
/100
|
#108
Exceptional
15.1%