Immigrants from Morocco vs Immigrants from Jamaica Child Poverty Among Boys Under 16
COMPARE
Immigrants from Morocco
Immigrants from Jamaica
Child Poverty Among Boys Under 16
Child Poverty Among Boys Under 16 Comparison
Immigrants from Morocco
Immigrants from Jamaica
16.7%
CHILD POVERTY AMONG BOYS UNDER 16
34.5/ 100
METRIC RATING
189th/ 347
METRIC RANK
20.1%
CHILD POVERTY AMONG BOYS UNDER 16
0.0/ 100
METRIC RATING
283rd/ 347
METRIC RANK
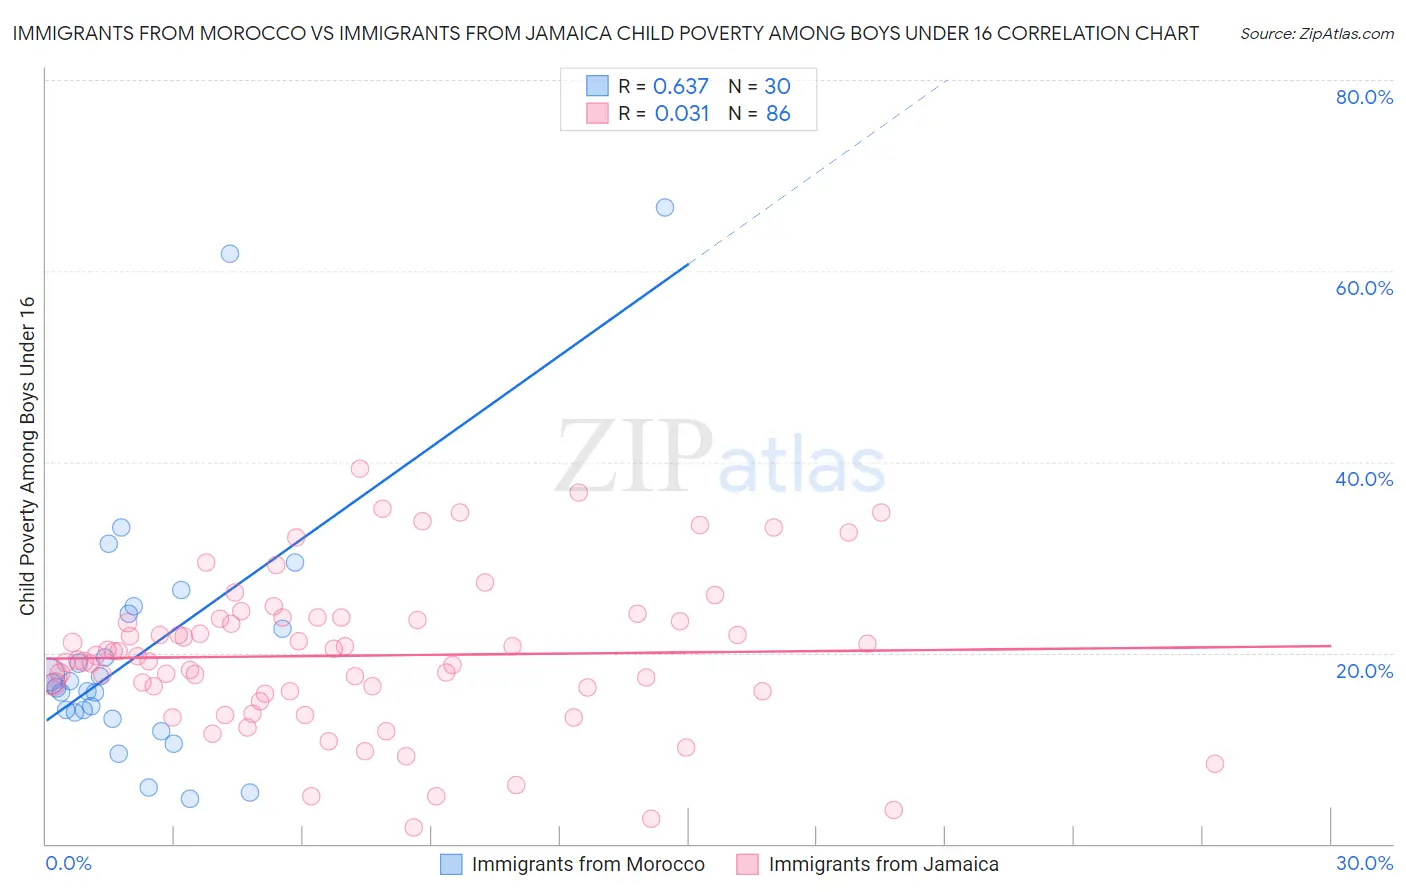
Immigrants from Morocco vs Immigrants from Jamaica Child Poverty Among Boys Under 16 Correlation Chart
The statistical analysis conducted on geographies consisting of 177,812,919 people shows a significant positive correlation between the proportion of Immigrants from Morocco and poverty level among boys under the age of 16 in the United States with a correlation coefficient (R) of 0.637 and weighted average of 16.7%. Similarly, the statistical analysis conducted on geographies consisting of 298,141,614 people shows no correlation between the proportion of Immigrants from Jamaica and poverty level among boys under the age of 16 in the United States with a correlation coefficient (R) of 0.031 and weighted average of 20.1%, a difference of 20.2%.
Child Poverty Among Boys Under 16 Correlation Summary
| Measurement | Immigrants from Morocco | Immigrants from Jamaica |
| Minimum | 4.7% | 1.7% |
| Maximum | 66.7% | 39.3% |
| Range | 61.9% | 37.6% |
| Mean | 20.3% | 19.7% |
| Median | 16.5% | 19.5% |
| Interquartile 25% (IQ1) | 13.8% | 16.0% |
| Interquartile 75% (IQ3) | 24.0% | 23.5% |
| Interquartile Range (IQR) | 10.3% | 7.5% |
| Standard Deviation (Sample) | 13.9% | 7.9% |
| Standard Deviation (Population) | 13.7% | 7.9% |
Similar Demographics by Child Poverty Among Boys Under 16
Demographics Similar to Immigrants from Morocco by Child Poverty Among Boys Under 16
In terms of child poverty among boys under 16, the demographic groups most similar to Immigrants from Morocco are Immigrants from Costa Rica (16.7%, a difference of 0.39%), Immigrants from South America (16.7%, a difference of 0.39%), Arab (16.8%, a difference of 0.42%), Hmong (16.6%, a difference of 0.47%), and Alaska Native (16.8%, a difference of 0.59%).
| Demographics | Rating | Rank | Child Poverty Among Boys Under 16 |
| Lebanese | 43.3 /100 | #182 | Average 16.6% |
| Kenyans | 41.0 /100 | #183 | Average 16.6% |
| Celtics | 40.6 /100 | #184 | Average 16.6% |
| Immigrants | Western Asia | 40.4 /100 | #185 | Average 16.6% |
| Hmong | 38.4 /100 | #186 | Fair 16.6% |
| Immigrants | Costa Rica | 37.8 /100 | #187 | Fair 16.7% |
| Immigrants | South America | 37.7 /100 | #188 | Fair 16.7% |
| Immigrants | Morocco | 34.5 /100 | #189 | Fair 16.7% |
| Arabs | 31.1 /100 | #190 | Fair 16.8% |
| Alaska Natives | 29.8 /100 | #191 | Fair 16.8% |
| Immigrants | Uganda | 21.6 /100 | #192 | Fair 17.0% |
| Immigrants | Iraq | 21.6 /100 | #193 | Fair 17.0% |
| Immigrants | Lebanon | 21.2 /100 | #194 | Fair 17.0% |
| Spanish | 20.8 /100 | #195 | Fair 17.0% |
| Spaniards | 20.5 /100 | #196 | Fair 17.1% |
Demographics Similar to Immigrants from Jamaica by Child Poverty Among Boys Under 16
In terms of child poverty among boys under 16, the demographic groups most similar to Immigrants from Jamaica are Comanche (20.1%, a difference of 0.13%), Immigrants from Zaire (20.1%, a difference of 0.18%), Barbadian (20.2%, a difference of 0.23%), Central American (20.1%, a difference of 0.24%), and Bangladeshi (20.0%, a difference of 0.36%).
| Demographics | Rating | Rank | Child Poverty Among Boys Under 16 |
| Sub-Saharan Africans | 0.0 /100 | #276 | Tragic 20.0% |
| Immigrants | Barbados | 0.0 /100 | #277 | Tragic 20.0% |
| Immigrants | West Indies | 0.0 /100 | #278 | Tragic 20.0% |
| Bangladeshis | 0.0 /100 | #279 | Tragic 20.0% |
| Central Americans | 0.0 /100 | #280 | Tragic 20.1% |
| Immigrants | Zaire | 0.0 /100 | #281 | Tragic 20.1% |
| Comanche | 0.0 /100 | #282 | Tragic 20.1% |
| Immigrants | Jamaica | 0.0 /100 | #283 | Tragic 20.1% |
| Barbadians | 0.0 /100 | #284 | Tragic 20.2% |
| Arapaho | 0.0 /100 | #285 | Tragic 20.2% |
| West Indians | 0.0 /100 | #286 | Tragic 20.3% |
| Immigrants | Belize | 0.0 /100 | #287 | Tragic 20.3% |
| Immigrants | St. Vincent and the Grenadines | 0.0 /100 | #288 | Tragic 20.3% |
| Blackfeet | 0.0 /100 | #289 | Tragic 20.4% |
| Senegalese | 0.0 /100 | #290 | Tragic 20.6% |