Immigrants from Sudan vs French Canadian Child Poverty Among Boys Under 16
COMPARE
Immigrants from Sudan
French Canadian
Child Poverty Among Boys Under 16
Child Poverty Among Boys Under 16 Comparison
Immigrants from Sudan
French Canadians
18.8%
CHILD POVERTY AMONG BOYS UNDER 16
0.6/ 100
METRIC RATING
241st/ 347
METRIC RANK
15.9%
CHILD POVERTY AMONG BOYS UNDER 16
76.6/ 100
METRIC RATING
155th/ 347
METRIC RANK
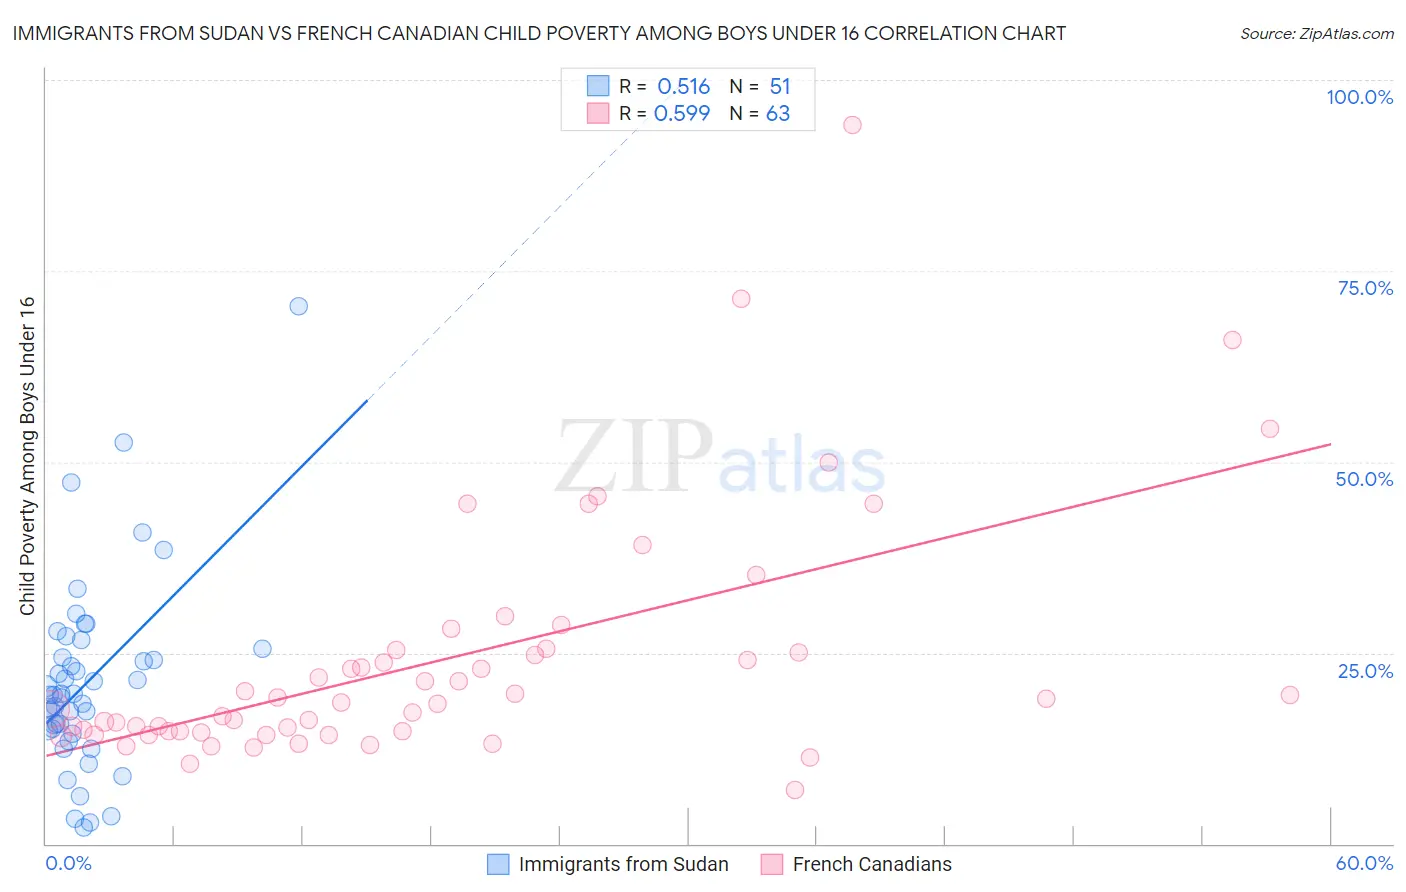
Immigrants from Sudan vs French Canadian Child Poverty Among Boys Under 16 Correlation Chart
The statistical analysis conducted on geographies consisting of 118,648,012 people shows a substantial positive correlation between the proportion of Immigrants from Sudan and poverty level among boys under the age of 16 in the United States with a correlation coefficient (R) of 0.516 and weighted average of 18.8%. Similarly, the statistical analysis conducted on geographies consisting of 488,484,984 people shows a substantial positive correlation between the proportion of French Canadians and poverty level among boys under the age of 16 in the United States with a correlation coefficient (R) of 0.599 and weighted average of 15.9%, a difference of 18.2%.
Child Poverty Among Boys Under 16 Correlation Summary
| Measurement | Immigrants from Sudan | French Canadian |
| Minimum | 2.2% | 7.1% |
| Maximum | 70.3% | 94.2% |
| Range | 68.1% | 87.1% |
| Mean | 21.2% | 24.1% |
| Median | 19.4% | 18.5% |
| Interquartile 25% (IQ1) | 14.8% | 14.7% |
| Interquartile 75% (IQ3) | 25.6% | 25.4% |
| Interquartile Range (IQR) | 10.8% | 10.6% |
| Standard Deviation (Sample) | 12.5% | 16.0% |
| Standard Deviation (Population) | 12.3% | 15.9% |
Similar Demographics by Child Poverty Among Boys Under 16
Demographics Similar to Immigrants from Sudan by Child Poverty Among Boys Under 16
In terms of child poverty among boys under 16, the demographic groups most similar to Immigrants from Sudan are Immigrants from Cuba (18.8%, a difference of 0.050%), Cape Verdean (18.7%, a difference of 0.39%), Ghanaian (18.9%, a difference of 0.50%), Immigrants from Laos (18.7%, a difference of 0.63%), and Immigrants from the Azores (18.9%, a difference of 0.84%).
| Demographics | Rating | Rank | Child Poverty Among Boys Under 16 |
| Nigerians | 1.1 /100 | #234 | Tragic 18.5% |
| Americans | 0.9 /100 | #235 | Tragic 18.6% |
| Sudanese | 0.9 /100 | #236 | Tragic 18.6% |
| Immigrants | Eritrea | 0.8 /100 | #237 | Tragic 18.6% |
| Immigrants | Laos | 0.8 /100 | #238 | Tragic 18.7% |
| Cape Verdeans | 0.7 /100 | #239 | Tragic 18.7% |
| Immigrants | Cuba | 0.6 /100 | #240 | Tragic 18.8% |
| Immigrants | Sudan | 0.6 /100 | #241 | Tragic 18.8% |
| Ghanaians | 0.5 /100 | #242 | Tragic 18.9% |
| Immigrants | Azores | 0.4 /100 | #243 | Tragic 18.9% |
| Immigrants | Middle Africa | 0.4 /100 | #244 | Tragic 18.9% |
| Cree | 0.4 /100 | #245 | Tragic 19.0% |
| Immigrants | Nicaragua | 0.4 /100 | #246 | Tragic 19.0% |
| Immigrants | Trinidad and Tobago | 0.3 /100 | #247 | Tragic 19.0% |
| Salvadorans | 0.3 /100 | #248 | Tragic 19.0% |
Demographics Similar to French Canadians by Child Poverty Among Boys Under 16
In terms of child poverty among boys under 16, the demographic groups most similar to French Canadians are Israeli (15.9%, a difference of 0.010%), Immigrants from Nepal (15.9%, a difference of 0.10%), Yugoslavian (15.9%, a difference of 0.11%), Syrian (15.9%, a difference of 0.15%), and Immigrants from Chile (15.9%, a difference of 0.28%).
| Demographics | Rating | Rank | Child Poverty Among Boys Under 16 |
| Brazilians | 81.0 /100 | #148 | Excellent 15.8% |
| Slovaks | 80.3 /100 | #149 | Excellent 15.8% |
| Immigrants | Jordan | 80.2 /100 | #150 | Excellent 15.8% |
| Puget Sound Salish | 79.8 /100 | #151 | Good 15.8% |
| Immigrants | Venezuela | 79.5 /100 | #152 | Good 15.8% |
| French | 78.7 /100 | #153 | Good 15.8% |
| Syrians | 77.5 /100 | #154 | Good 15.9% |
| French Canadians | 76.6 /100 | #155 | Good 15.9% |
| Israelis | 76.5 /100 | #156 | Good 15.9% |
| Immigrants | Nepal | 76.0 /100 | #157 | Good 15.9% |
| Yugoslavians | 75.9 /100 | #158 | Good 15.9% |
| Immigrants | Chile | 74.8 /100 | #159 | Good 15.9% |
| Immigrants | Northern Africa | 71.3 /100 | #160 | Good 16.0% |
| Immigrants | Oceania | 71.3 /100 | #161 | Good 16.0% |
| Guamanians/Chamorros | 69.6 /100 | #162 | Good 16.1% |