Immigrants from Morocco vs Immigrants from Central America Child Poverty Among Boys Under 16
COMPARE
Immigrants from Morocco
Immigrants from Central America
Child Poverty Among Boys Under 16
Child Poverty Among Boys Under 16 Comparison
Immigrants from Morocco
Immigrants from Central America
16.7%
CHILD POVERTY AMONG BOYS UNDER 16
34.5/ 100
METRIC RATING
189th/ 347
METRIC RANK
21.3%
CHILD POVERTY AMONG BOYS UNDER 16
0.0/ 100
METRIC RATING
304th/ 347
METRIC RANK
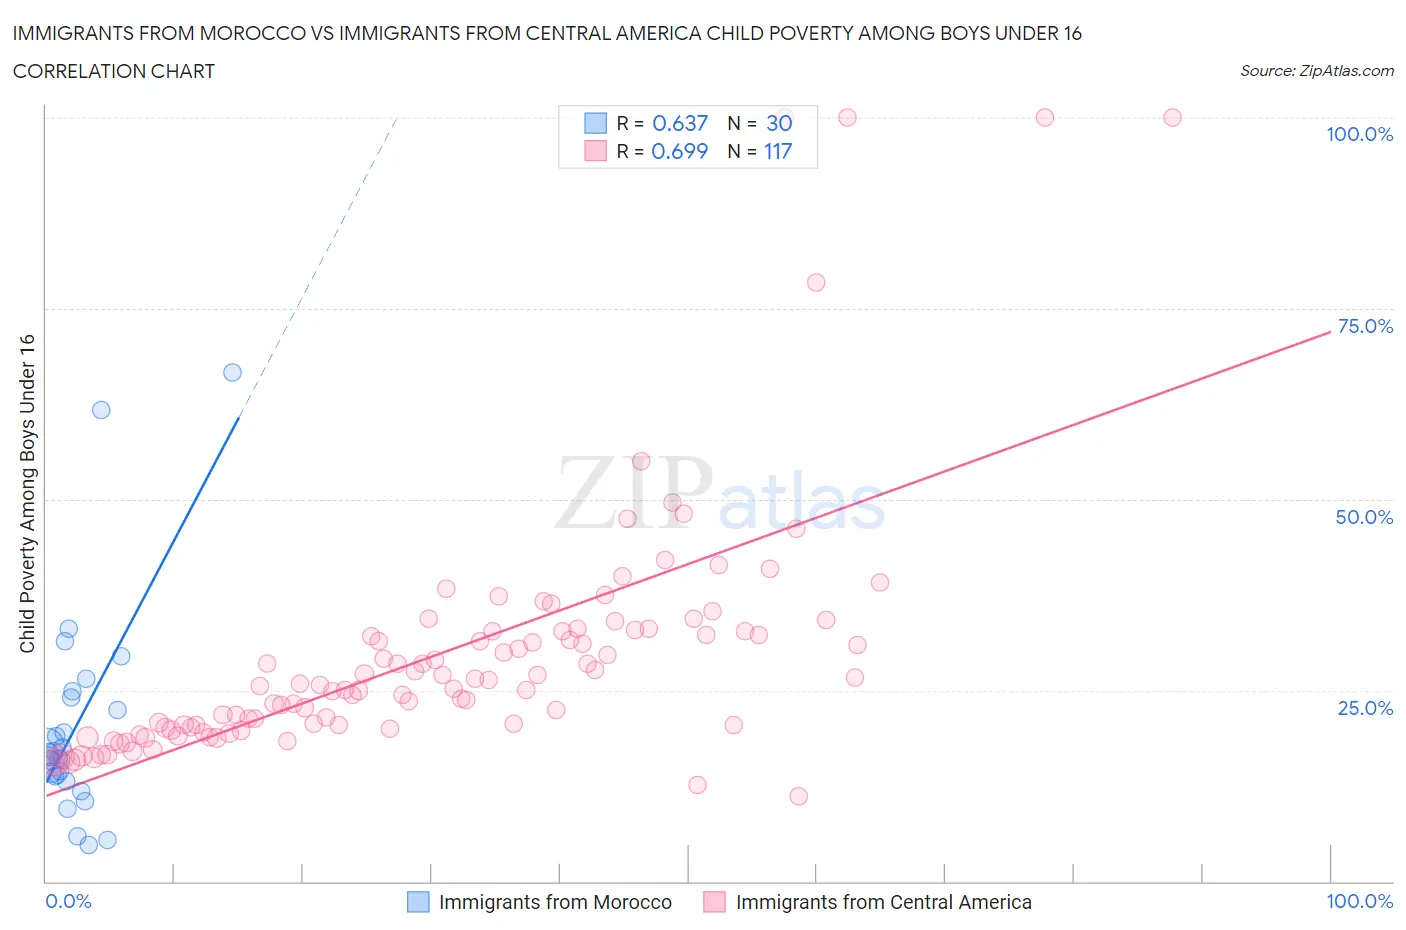
Immigrants from Morocco vs Immigrants from Central America Child Poverty Among Boys Under 16 Correlation Chart
The statistical analysis conducted on geographies consisting of 177,812,919 people shows a significant positive correlation between the proportion of Immigrants from Morocco and poverty level among boys under the age of 16 in the United States with a correlation coefficient (R) of 0.637 and weighted average of 16.7%. Similarly, the statistical analysis conducted on geographies consisting of 522,928,999 people shows a significant positive correlation between the proportion of Immigrants from Central America and poverty level among boys under the age of 16 in the United States with a correlation coefficient (R) of 0.699 and weighted average of 21.3%, a difference of 27.2%.
Child Poverty Among Boys Under 16 Correlation Summary
| Measurement | Immigrants from Morocco | Immigrants from Central America |
| Minimum | 4.7% | 11.1% |
| Maximum | 66.7% | 100.0% |
| Range | 61.9% | 88.9% |
| Mean | 20.3% | 29.6% |
| Median | 16.5% | 25.7% |
| Interquartile 25% (IQ1) | 13.8% | 20.1% |
| Interquartile 75% (IQ3) | 24.0% | 32.7% |
| Interquartile Range (IQR) | 10.3% | 12.6% |
| Standard Deviation (Sample) | 13.9% | 16.4% |
| Standard Deviation (Population) | 13.7% | 16.4% |
Similar Demographics by Child Poverty Among Boys Under 16
Demographics Similar to Immigrants from Morocco by Child Poverty Among Boys Under 16
In terms of child poverty among boys under 16, the demographic groups most similar to Immigrants from Morocco are Immigrants from Costa Rica (16.7%, a difference of 0.39%), Immigrants from South America (16.7%, a difference of 0.39%), Arab (16.8%, a difference of 0.42%), Hmong (16.6%, a difference of 0.47%), and Alaska Native (16.8%, a difference of 0.59%).
| Demographics | Rating | Rank | Child Poverty Among Boys Under 16 |
| Lebanese | 43.3 /100 | #182 | Average 16.6% |
| Kenyans | 41.0 /100 | #183 | Average 16.6% |
| Celtics | 40.6 /100 | #184 | Average 16.6% |
| Immigrants | Western Asia | 40.4 /100 | #185 | Average 16.6% |
| Hmong | 38.4 /100 | #186 | Fair 16.6% |
| Immigrants | Costa Rica | 37.8 /100 | #187 | Fair 16.7% |
| Immigrants | South America | 37.7 /100 | #188 | Fair 16.7% |
| Immigrants | Morocco | 34.5 /100 | #189 | Fair 16.7% |
| Arabs | 31.1 /100 | #190 | Fair 16.8% |
| Alaska Natives | 29.8 /100 | #191 | Fair 16.8% |
| Immigrants | Uganda | 21.6 /100 | #192 | Fair 17.0% |
| Immigrants | Iraq | 21.6 /100 | #193 | Fair 17.0% |
| Immigrants | Lebanon | 21.2 /100 | #194 | Fair 17.0% |
| Spanish | 20.8 /100 | #195 | Fair 17.0% |
| Spaniards | 20.5 /100 | #196 | Fair 17.1% |
Demographics Similar to Immigrants from Central America by Child Poverty Among Boys Under 16
In terms of child poverty among boys under 16, the demographic groups most similar to Immigrants from Central America are Immigrants from Haiti (21.3%, a difference of 0.060%), Kiowa (21.3%, a difference of 0.17%), Immigrants from Grenada (21.3%, a difference of 0.18%), Choctaw (21.3%, a difference of 0.27%), and Somali (21.1%, a difference of 0.59%).
| Demographics | Rating | Rank | Child Poverty Among Boys Under 16 |
| Hispanics or Latinos | 0.0 /100 | #297 | Tragic 20.9% |
| Chippewa | 0.0 /100 | #298 | Tragic 21.0% |
| Immigrants | Caribbean | 0.0 /100 | #299 | Tragic 21.0% |
| Haitians | 0.0 /100 | #300 | Tragic 21.0% |
| Guatemalans | 0.0 /100 | #301 | Tragic 21.1% |
| Somalis | 0.0 /100 | #302 | Tragic 21.1% |
| Immigrants | Haiti | 0.0 /100 | #303 | Tragic 21.3% |
| Immigrants | Central America | 0.0 /100 | #304 | Tragic 21.3% |
| Kiowa | 0.0 /100 | #305 | Tragic 21.3% |
| Immigrants | Grenada | 0.0 /100 | #306 | Tragic 21.3% |
| Choctaw | 0.0 /100 | #307 | Tragic 21.3% |
| Immigrants | Mexico | 0.0 /100 | #308 | Tragic 21.5% |
| Seminole | 0.0 /100 | #309 | Tragic 21.5% |
| Creek | 0.0 /100 | #310 | Tragic 21.5% |
| Bahamians | 0.0 /100 | #311 | Tragic 21.6% |