Norwegian vs Guamanian/Chamorro Receiving Food Stamps
COMPARE
Norwegian
Guamanian/Chamorro
Receiving Food Stamps
Receiving Food Stamps Comparison
Norwegians
Guamanians/Chamorros
9.0%
RECEIVING FOOD STAMPS
99.9/ 100
METRIC RATING
15th/ 347
METRIC RANK
11.7%
RECEIVING FOOD STAMPS
54.2/ 100
METRIC RATING
172nd/ 347
METRIC RANK
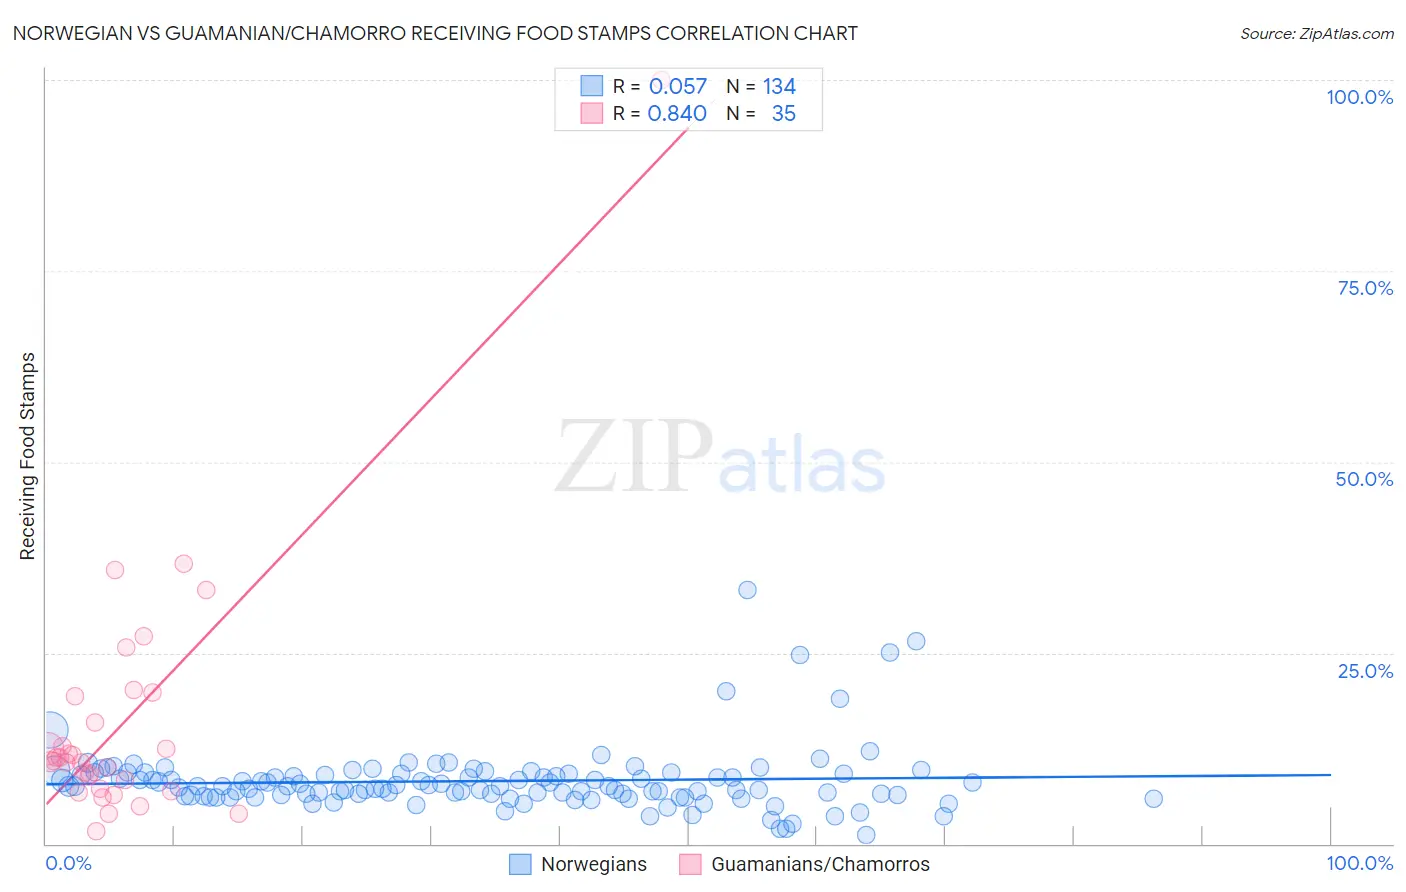
Norwegian vs Guamanian/Chamorro Receiving Food Stamps Correlation Chart
The statistical analysis conducted on geographies consisting of 530,518,584 people shows a slight positive correlation between the proportion of Norwegians and percentage of population receiving government assistance and/or food stamps in the United States with a correlation coefficient (R) of 0.057 and weighted average of 9.0%. Similarly, the statistical analysis conducted on geographies consisting of 221,700,710 people shows a very strong positive correlation between the proportion of Guamanians/Chamorros and percentage of population receiving government assistance and/or food stamps in the United States with a correlation coefficient (R) of 0.840 and weighted average of 11.7%, a difference of 30.3%.
Receiving Food Stamps Correlation Summary
| Measurement | Norwegian | Guamanian/Chamorro |
| Minimum | 1.1% | 1.7% |
| Maximum | 33.3% | 100.0% |
| Range | 32.2% | 98.3% |
| Mean | 8.2% | 15.8% |
| Median | 7.5% | 10.8% |
| Interquartile 25% (IQ1) | 6.3% | 7.3% |
| Interquartile 75% (IQ3) | 9.1% | 19.4% |
| Interquartile Range (IQR) | 2.8% | 12.1% |
| Standard Deviation (Sample) | 4.3% | 17.1% |
| Standard Deviation (Population) | 4.3% | 16.9% |
Similar Demographics by Receiving Food Stamps
Demographics Similar to Norwegians by Receiving Food Stamps
In terms of receiving food stamps, the demographic groups most similar to Norwegians are Immigrants from Japan (9.0%, a difference of 0.27%), Immigrants from Scotland (9.0%, a difference of 0.43%), Maltese (8.9%, a difference of 0.66%), Bulgarian (8.9%, a difference of 0.79%), and Danish (9.0%, a difference of 0.88%).
| Demographics | Rating | Rank | Receiving Food Stamps |
| Burmese | 99.9 /100 | #8 | Exceptional 8.6% |
| Immigrants | Korea | 99.9 /100 | #9 | Exceptional 8.7% |
| Immigrants | South Central Asia | 99.9 /100 | #10 | Exceptional 8.8% |
| Okinawans | 99.9 /100 | #11 | Exceptional 8.9% |
| Cypriots | 99.9 /100 | #12 | Exceptional 8.9% |
| Bulgarians | 99.9 /100 | #13 | Exceptional 8.9% |
| Maltese | 99.9 /100 | #14 | Exceptional 8.9% |
| Norwegians | 99.9 /100 | #15 | Exceptional 9.0% |
| Immigrants | Japan | 99.9 /100 | #16 | Exceptional 9.0% |
| Immigrants | Scotland | 99.9 /100 | #17 | Exceptional 9.0% |
| Danes | 99.9 /100 | #18 | Exceptional 9.0% |
| Immigrants | Hong Kong | 99.8 /100 | #19 | Exceptional 9.1% |
| Latvians | 99.8 /100 | #20 | Exceptional 9.1% |
| Luxembourgers | 99.8 /100 | #21 | Exceptional 9.1% |
| Immigrants | Australia | 99.8 /100 | #22 | Exceptional 9.2% |
Demographics Similar to Guamanians/Chamorros by Receiving Food Stamps
In terms of receiving food stamps, the demographic groups most similar to Guamanians/Chamorros are Immigrants from Syria (11.7%, a difference of 0.11%), Immigrants from Western Asia (11.6%, a difference of 0.32%), Costa Rican (11.6%, a difference of 0.53%), Immigrants from Eritrea (11.7%, a difference of 0.59%), and Immigrants from Eastern Africa (11.6%, a difference of 0.60%).
| Demographics | Rating | Rank | Receiving Food Stamps |
| Arabs | 64.7 /100 | #165 | Good 11.5% |
| Immigrants | Belarus | 62.8 /100 | #166 | Good 11.5% |
| Kenyans | 60.2 /100 | #167 | Good 11.6% |
| Tlingit-Haida | 59.1 /100 | #168 | Average 11.6% |
| Immigrants | Eastern Africa | 58.3 /100 | #169 | Average 11.6% |
| Costa Ricans | 57.9 /100 | #170 | Average 11.6% |
| Immigrants | Western Asia | 56.4 /100 | #171 | Average 11.6% |
| Guamanians/Chamorros | 54.2 /100 | #172 | Average 11.7% |
| Immigrants | Syria | 53.4 /100 | #173 | Average 11.7% |
| Immigrants | Eritrea | 50.0 /100 | #174 | Average 11.7% |
| Osage | 49.8 /100 | #175 | Average 11.7% |
| Peruvians | 49.3 /100 | #176 | Average 11.7% |
| Immigrants | Ukraine | 48.4 /100 | #177 | Average 11.8% |
| German Russians | 48.1 /100 | #178 | Average 11.8% |
| Immigrants | Kenya | 46.4 /100 | #179 | Average 11.8% |