Vietnamese vs Guamanian/Chamorro Receiving Food Stamps
COMPARE
Vietnamese
Guamanian/Chamorro
Receiving Food Stamps
Receiving Food Stamps Comparison
Vietnamese
Guamanians/Chamorros
15.7%
RECEIVING FOOD STAMPS
0.0/ 100
METRIC RATING
293rd/ 347
METRIC RANK
11.7%
RECEIVING FOOD STAMPS
54.2/ 100
METRIC RATING
172nd/ 347
METRIC RANK
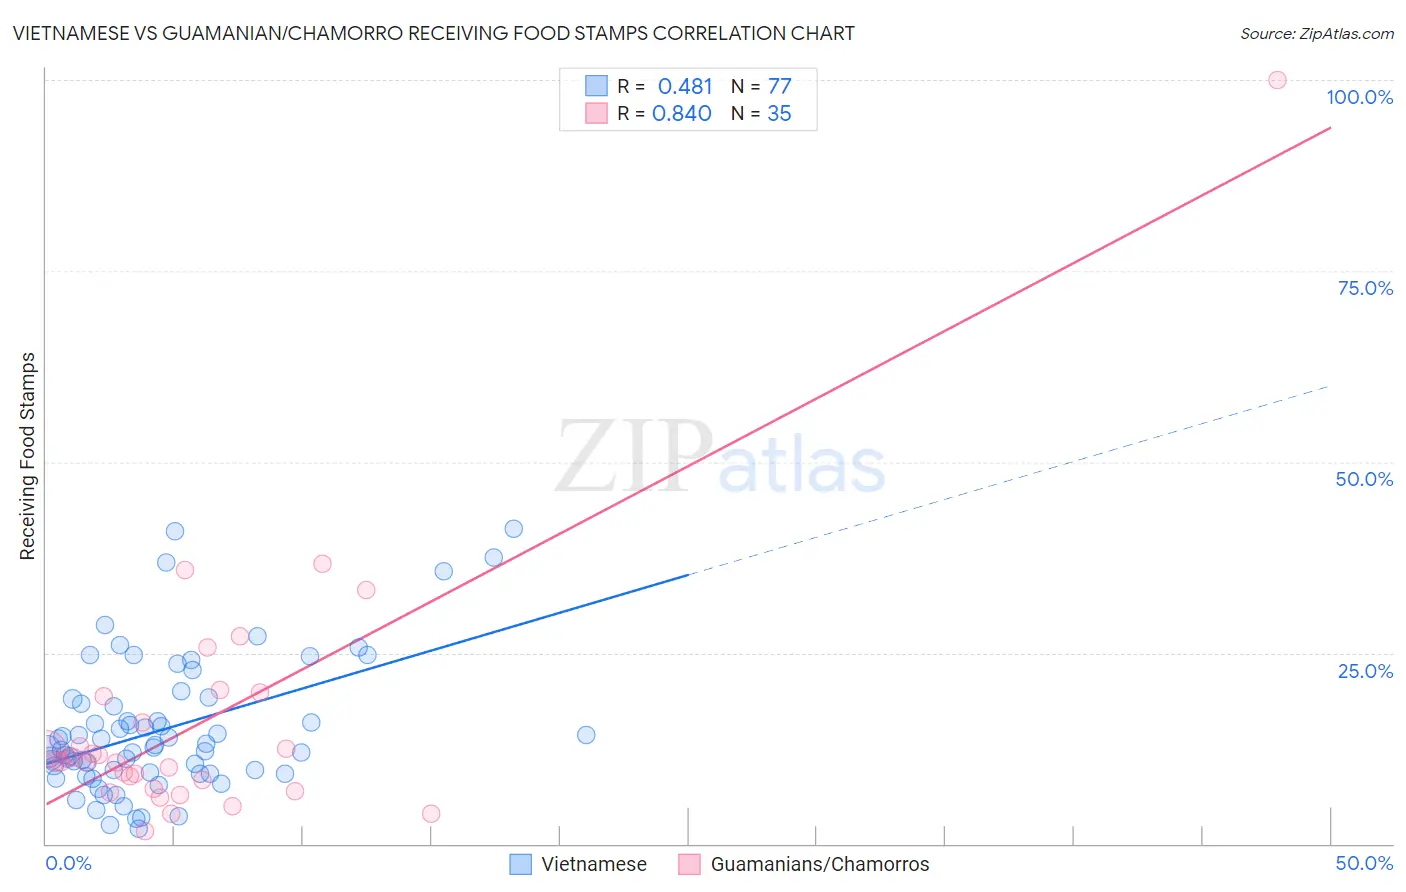
Vietnamese vs Guamanian/Chamorro Receiving Food Stamps Correlation Chart
The statistical analysis conducted on geographies consisting of 170,448,665 people shows a moderate positive correlation between the proportion of Vietnamese and percentage of population receiving government assistance and/or food stamps in the United States with a correlation coefficient (R) of 0.481 and weighted average of 15.7%. Similarly, the statistical analysis conducted on geographies consisting of 221,700,710 people shows a very strong positive correlation between the proportion of Guamanians/Chamorros and percentage of population receiving government assistance and/or food stamps in the United States with a correlation coefficient (R) of 0.840 and weighted average of 11.7%, a difference of 34.2%.
Receiving Food Stamps Correlation Summary
| Measurement | Vietnamese | Guamanian/Chamorro |
| Minimum | 1.9% | 1.7% |
| Maximum | 41.3% | 100.0% |
| Range | 39.4% | 98.3% |
| Mean | 15.0% | 15.8% |
| Median | 12.6% | 10.8% |
| Interquartile 25% (IQ1) | 9.2% | 7.3% |
| Interquartile 75% (IQ3) | 18.6% | 19.4% |
| Interquartile Range (IQR) | 9.4% | 12.1% |
| Standard Deviation (Sample) | 8.8% | 17.1% |
| Standard Deviation (Population) | 8.8% | 16.9% |
Similar Demographics by Receiving Food Stamps
Demographics Similar to Vietnamese by Receiving Food Stamps
In terms of receiving food stamps, the demographic groups most similar to Vietnamese are Immigrants from Latin America (15.7%, a difference of 0.11%), Alaska Native (15.6%, a difference of 0.30%), Immigrants from Honduras (15.7%, a difference of 0.43%), Tsimshian (15.7%, a difference of 0.44%), and Immigrants from Bahamas (15.8%, a difference of 0.60%).
| Demographics | Rating | Rank | Receiving Food Stamps |
| Africans | 0.0 /100 | #286 | Tragic 15.1% |
| Immigrants | Mexico | 0.0 /100 | #287 | Tragic 15.2% |
| Immigrants | Belize | 0.0 /100 | #288 | Tragic 15.2% |
| Immigrants | Senegal | 0.0 /100 | #289 | Tragic 15.3% |
| Senegalese | 0.0 /100 | #290 | Tragic 15.4% |
| Hondurans | 0.0 /100 | #291 | Tragic 15.5% |
| Alaska Natives | 0.0 /100 | #292 | Tragic 15.6% |
| Vietnamese | 0.0 /100 | #293 | Tragic 15.7% |
| Immigrants | Latin America | 0.0 /100 | #294 | Tragic 15.7% |
| Immigrants | Honduras | 0.0 /100 | #295 | Tragic 15.7% |
| Tsimshian | 0.0 /100 | #296 | Tragic 15.7% |
| Immigrants | Bahamas | 0.0 /100 | #297 | Tragic 15.8% |
| Immigrants | Trinidad and Tobago | 0.0 /100 | #298 | Tragic 15.8% |
| Hispanics or Latinos | 0.0 /100 | #299 | Tragic 15.8% |
| Immigrants | Bangladesh | 0.0 /100 | #300 | Tragic 15.9% |
Demographics Similar to Guamanians/Chamorros by Receiving Food Stamps
In terms of receiving food stamps, the demographic groups most similar to Guamanians/Chamorros are Immigrants from Syria (11.7%, a difference of 0.11%), Immigrants from Western Asia (11.6%, a difference of 0.32%), Costa Rican (11.6%, a difference of 0.53%), Immigrants from Eritrea (11.7%, a difference of 0.59%), and Immigrants from Eastern Africa (11.6%, a difference of 0.60%).
| Demographics | Rating | Rank | Receiving Food Stamps |
| Arabs | 64.7 /100 | #165 | Good 11.5% |
| Immigrants | Belarus | 62.8 /100 | #166 | Good 11.5% |
| Kenyans | 60.2 /100 | #167 | Good 11.6% |
| Tlingit-Haida | 59.1 /100 | #168 | Average 11.6% |
| Immigrants | Eastern Africa | 58.3 /100 | #169 | Average 11.6% |
| Costa Ricans | 57.9 /100 | #170 | Average 11.6% |
| Immigrants | Western Asia | 56.4 /100 | #171 | Average 11.6% |
| Guamanians/Chamorros | 54.2 /100 | #172 | Average 11.7% |
| Immigrants | Syria | 53.4 /100 | #173 | Average 11.7% |
| Immigrants | Eritrea | 50.0 /100 | #174 | Average 11.7% |
| Osage | 49.8 /100 | #175 | Average 11.7% |
| Peruvians | 49.3 /100 | #176 | Average 11.7% |
| Immigrants | Ukraine | 48.4 /100 | #177 | Average 11.8% |
| German Russians | 48.1 /100 | #178 | Average 11.8% |
| Immigrants | Kenya | 46.4 /100 | #179 | Average 11.8% |