Immigrants from Lithuania vs Immigrants from Romania In Labor Force | Age 20-24
COMPARE
Immigrants from Lithuania
Immigrants from Romania
In Labor Force | Age 20-24
In Labor Force | Age 20-24 Comparison
Immigrants from Lithuania
Immigrants from Romania
76.1%
IN LABOR FORCE | AGE 20-24
98.0/ 100
METRIC RATING
97th/ 347
METRIC RANK
75.2%
IN LABOR FORCE | AGE 20-24
64.6/ 100
METRIC RATING
162nd/ 347
METRIC RANK
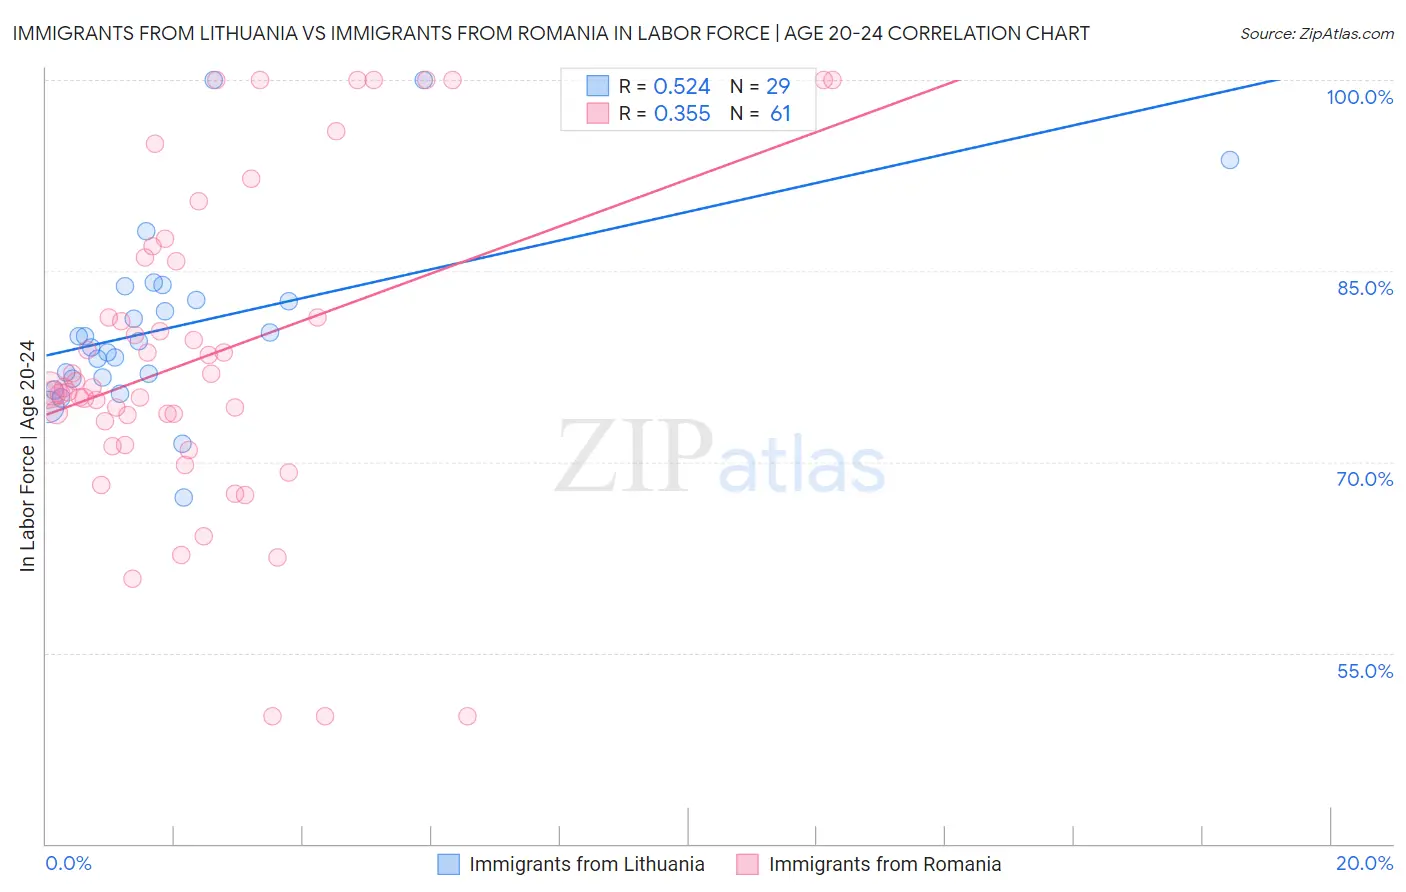
Immigrants from Lithuania vs Immigrants from Romania In Labor Force | Age 20-24 Correlation Chart
The statistical analysis conducted on geographies consisting of 117,715,307 people shows a substantial positive correlation between the proportion of Immigrants from Lithuania and labor force participation rate among population between the ages 20 and 24 in the United States with a correlation coefficient (R) of 0.524 and weighted average of 76.1%. Similarly, the statistical analysis conducted on geographies consisting of 256,948,793 people shows a mild positive correlation between the proportion of Immigrants from Romania and labor force participation rate among population between the ages 20 and 24 in the United States with a correlation coefficient (R) of 0.355 and weighted average of 75.2%, a difference of 1.2%.
In Labor Force | Age 20-24 Correlation Summary
| Measurement | Immigrants from Lithuania | Immigrants from Romania |
| Minimum | 67.2% | 50.0% |
| Maximum | 100.0% | 100.0% |
| Range | 32.8% | 50.0% |
| Mean | 80.7% | 78.3% |
| Median | 79.5% | 75.9% |
| Interquartile 25% (IQ1) | 76.6% | 72.2% |
| Interquartile 75% (IQ3) | 83.2% | 85.9% |
| Interquartile Range (IQR) | 6.7% | 13.7% |
| Standard Deviation (Sample) | 7.3% | 12.4% |
| Standard Deviation (Population) | 7.2% | 12.3% |
Similar Demographics by In Labor Force | Age 20-24
Demographics Similar to Immigrants from Lithuania by In Labor Force | Age 20-24
In terms of in labor force | age 20-24, the demographic groups most similar to Immigrants from Lithuania are Immigrants from Oceania (76.1%, a difference of 0.0%), American (76.1%, a difference of 0.030%), Shoshone (76.1%, a difference of 0.040%), Immigrants from Poland (76.1%, a difference of 0.050%), and Latvian (76.1%, a difference of 0.060%).
| Demographics | Rating | Rank | In Labor Force | Age 20-24 |
| Immigrants | Burma/Myanmar | 99.1 /100 | #90 | Exceptional 76.3% |
| Sierra Leoneans | 99.0 /100 | #91 | Exceptional 76.3% |
| Maltese | 98.9 /100 | #92 | Exceptional 76.3% |
| Hungarians | 98.9 /100 | #93 | Exceptional 76.3% |
| Potawatomi | 98.5 /100 | #94 | Exceptional 76.2% |
| Immigrants | Germany | 98.5 /100 | #95 | Exceptional 76.2% |
| Immigrants | Nonimmigrants | 98.5 /100 | #96 | Exceptional 76.2% |
| Immigrants | Lithuania | 98.0 /100 | #97 | Exceptional 76.1% |
| Immigrants | Oceania | 98.0 /100 | #98 | Exceptional 76.1% |
| Americans | 97.8 /100 | #99 | Exceptional 76.1% |
| Shoshone | 97.8 /100 | #100 | Exceptional 76.1% |
| Immigrants | Poland | 97.7 /100 | #101 | Exceptional 76.1% |
| Latvians | 97.6 /100 | #102 | Exceptional 76.1% |
| Immigrants | North Macedonia | 97.5 /100 | #103 | Exceptional 76.1% |
| Macedonians | 97.2 /100 | #104 | Exceptional 76.0% |
Demographics Similar to Immigrants from Romania by In Labor Force | Age 20-24
In terms of in labor force | age 20-24, the demographic groups most similar to Immigrants from Romania are New Zealander (75.2%, a difference of 0.010%), Costa Rican (75.2%, a difference of 0.010%), Bolivian (75.2%, a difference of 0.010%), Afghan (75.2%, a difference of 0.020%), and Cambodian (75.2%, a difference of 0.060%).
| Demographics | Rating | Rank | In Labor Force | Age 20-24 |
| Immigrants | Guatemala | 71.9 /100 | #155 | Good 75.3% |
| Immigrants | El Salvador | 71.7 /100 | #156 | Good 75.3% |
| Immigrants | Western Europe | 71.5 /100 | #157 | Good 75.3% |
| Immigrants | Bolivia | 71.0 /100 | #158 | Good 75.3% |
| South American Indians | 69.0 /100 | #159 | Good 75.3% |
| Japanese | 68.7 /100 | #160 | Good 75.3% |
| New Zealanders | 65.4 /100 | #161 | Good 75.2% |
| Immigrants | Romania | 64.6 /100 | #162 | Good 75.2% |
| Costa Ricans | 64.2 /100 | #163 | Good 75.2% |
| Bolivians | 64.0 /100 | #164 | Good 75.2% |
| Afghans | 63.5 /100 | #165 | Good 75.2% |
| Cambodians | 60.5 /100 | #166 | Good 75.2% |
| Immigrants | South Eastern Asia | 57.5 /100 | #167 | Average 75.1% |
| Immigrants | Western Africa | 56.7 /100 | #168 | Average 75.1% |
| Immigrants | Philippines | 55.8 /100 | #169 | Average 75.1% |