Immigrants from Lithuania vs Immigrants from Serbia Male Poverty
COMPARE
Immigrants from Lithuania
Immigrants from Serbia
Male Poverty
Male Poverty Comparison
Immigrants from Lithuania
Immigrants from Serbia
9.4%
MALE POVERTY
99.9/ 100
METRIC RATING
13th/ 347
METRIC RANK
10.0%
MALE POVERTY
98.9/ 100
METRIC RATING
45th/ 347
METRIC RANK
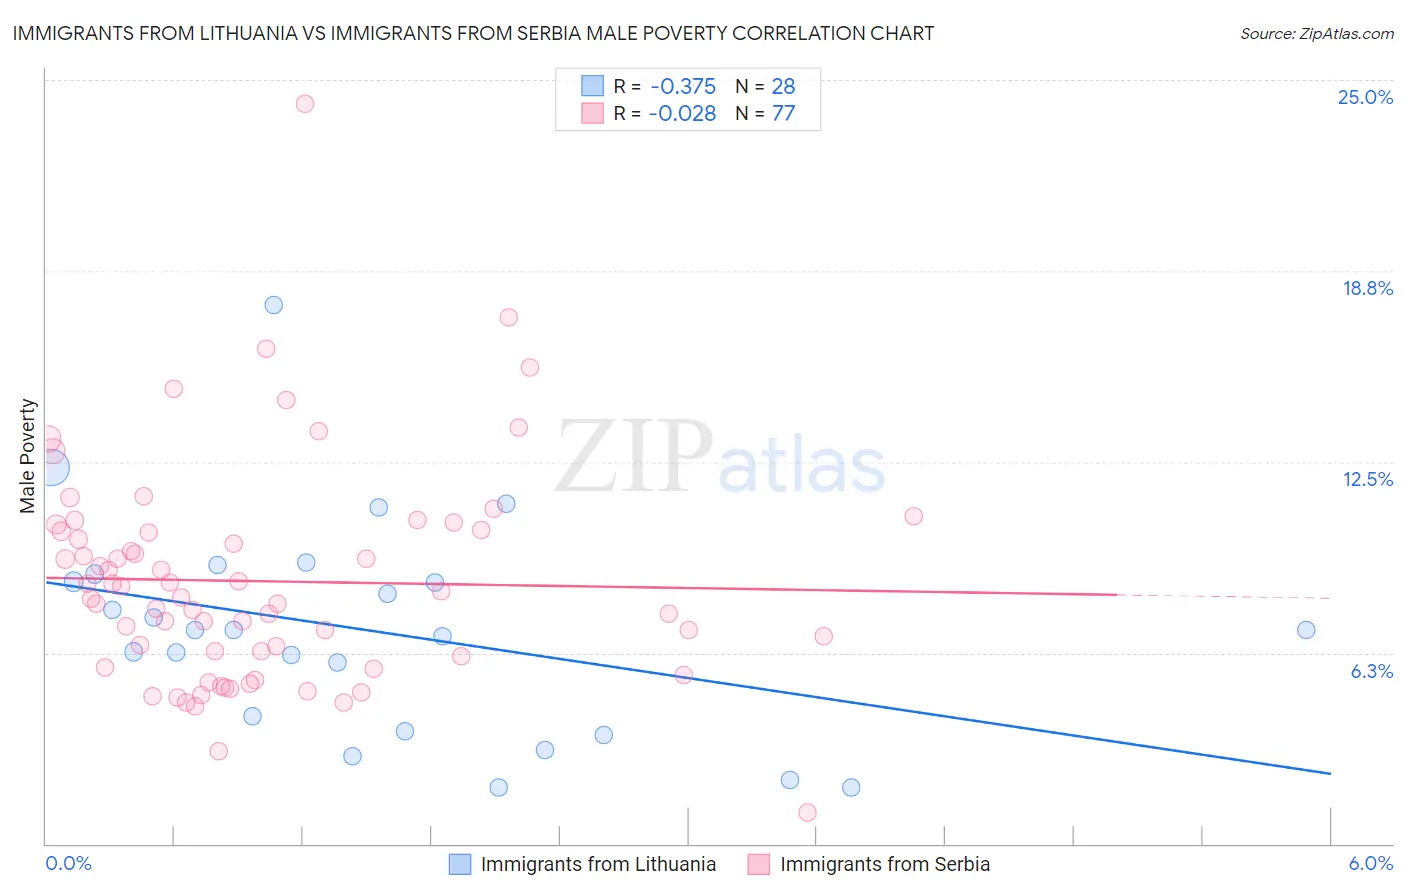
Immigrants from Lithuania vs Immigrants from Serbia Male Poverty Correlation Chart
The statistical analysis conducted on geographies consisting of 117,705,146 people shows a mild negative correlation between the proportion of Immigrants from Lithuania and poverty level among males in the United States with a correlation coefficient (R) of -0.375 and weighted average of 9.4%. Similarly, the statistical analysis conducted on geographies consisting of 131,714,857 people shows no correlation between the proportion of Immigrants from Serbia and poverty level among males in the United States with a correlation coefficient (R) of -0.028 and weighted average of 10.0%, a difference of 6.0%.
Male Poverty Correlation Summary
| Measurement | Immigrants from Lithuania | Immigrants from Serbia |
| Minimum | 1.8% | 1.0% |
| Maximum | 17.6% | 24.2% |
| Range | 15.8% | 23.2% |
| Mean | 7.0% | 8.6% |
| Median | 7.0% | 8.1% |
| Interquartile 25% (IQ1) | 3.9% | 5.9% |
| Interquartile 75% (IQ3) | 8.7% | 10.3% |
| Interquartile Range (IQR) | 4.8% | 4.3% |
| Standard Deviation (Sample) | 3.5% | 3.6% |
| Standard Deviation (Population) | 3.5% | 3.6% |
Similar Demographics by Male Poverty
Demographics Similar to Immigrants from Lithuania by Male Poverty
In terms of male poverty, the demographic groups most similar to Immigrants from Lithuania are Immigrants from Bolivia (9.4%, a difference of 0.12%), Bolivian (9.4%, a difference of 0.17%), Immigrants from North Macedonia (9.4%, a difference of 0.38%), Bhutanese (9.5%, a difference of 0.67%), and Bulgarian (9.3%, a difference of 0.82%).
| Demographics | Rating | Rank | Male Poverty |
| Assyrians/Chaldeans/Syriacs | 99.9 /100 | #6 | Exceptional 9.1% |
| Immigrants | Ireland | 99.9 /100 | #7 | Exceptional 9.1% |
| Filipinos | 99.9 /100 | #8 | Exceptional 9.2% |
| Immigrants | South Central Asia | 99.9 /100 | #9 | Exceptional 9.3% |
| Bulgarians | 99.9 /100 | #10 | Exceptional 9.3% |
| Bolivians | 99.9 /100 | #11 | Exceptional 9.4% |
| Immigrants | Bolivia | 99.9 /100 | #12 | Exceptional 9.4% |
| Immigrants | Lithuania | 99.9 /100 | #13 | Exceptional 9.4% |
| Immigrants | North Macedonia | 99.8 /100 | #14 | Exceptional 9.4% |
| Bhutanese | 99.8 /100 | #15 | Exceptional 9.5% |
| Luxembourgers | 99.8 /100 | #16 | Exceptional 9.5% |
| Norwegians | 99.8 /100 | #17 | Exceptional 9.5% |
| Lithuanians | 99.8 /100 | #18 | Exceptional 9.5% |
| Immigrants | Hong Kong | 99.7 /100 | #19 | Exceptional 9.6% |
| Latvians | 99.7 /100 | #20 | Exceptional 9.6% |
Demographics Similar to Immigrants from Serbia by Male Poverty
In terms of male poverty, the demographic groups most similar to Immigrants from Serbia are Turkish (10.0%, a difference of 0.020%), Immigrants from Singapore (10.0%, a difference of 0.15%), Immigrants from Japan (10.0%, a difference of 0.15%), Immigrants from Romania (9.9%, a difference of 0.18%), and Slovene (10.0%, a difference of 0.24%).
| Demographics | Rating | Rank | Male Poverty |
| Immigrants | Pakistan | 99.2 /100 | #38 | Exceptional 9.9% |
| Russians | 99.2 /100 | #39 | Exceptional 9.9% |
| Cypriots | 99.2 /100 | #40 | Exceptional 9.9% |
| Koreans | 99.2 /100 | #41 | Exceptional 9.9% |
| Immigrants | Iran | 99.1 /100 | #42 | Exceptional 9.9% |
| Immigrants | Moldova | 99.0 /100 | #43 | Exceptional 9.9% |
| Immigrants | Romania | 98.9 /100 | #44 | Exceptional 9.9% |
| Immigrants | Serbia | 98.9 /100 | #45 | Exceptional 10.0% |
| Turks | 98.9 /100 | #46 | Exceptional 10.0% |
| Immigrants | Singapore | 98.8 /100 | #47 | Exceptional 10.0% |
| Immigrants | Japan | 98.8 /100 | #48 | Exceptional 10.0% |
| Slovenes | 98.8 /100 | #49 | Exceptional 10.0% |
| Immigrants | Philippines | 98.7 /100 | #50 | Exceptional 10.0% |
| Immigrants | Croatia | 98.7 /100 | #51 | Exceptional 10.0% |
| Asians | 98.7 /100 | #52 | Exceptional 10.0% |