Immigrants from Lithuania vs Austrian Male Poverty
COMPARE
Immigrants from Lithuania
Austrian
Male Poverty
Male Poverty Comparison
Immigrants from Lithuania
Austrians
9.4%
MALE POVERTY
99.9/ 100
METRIC RATING
13th/ 347
METRIC RANK
10.1%
MALE POVERTY
97.8/ 100
METRIC RATING
61st/ 347
METRIC RANK
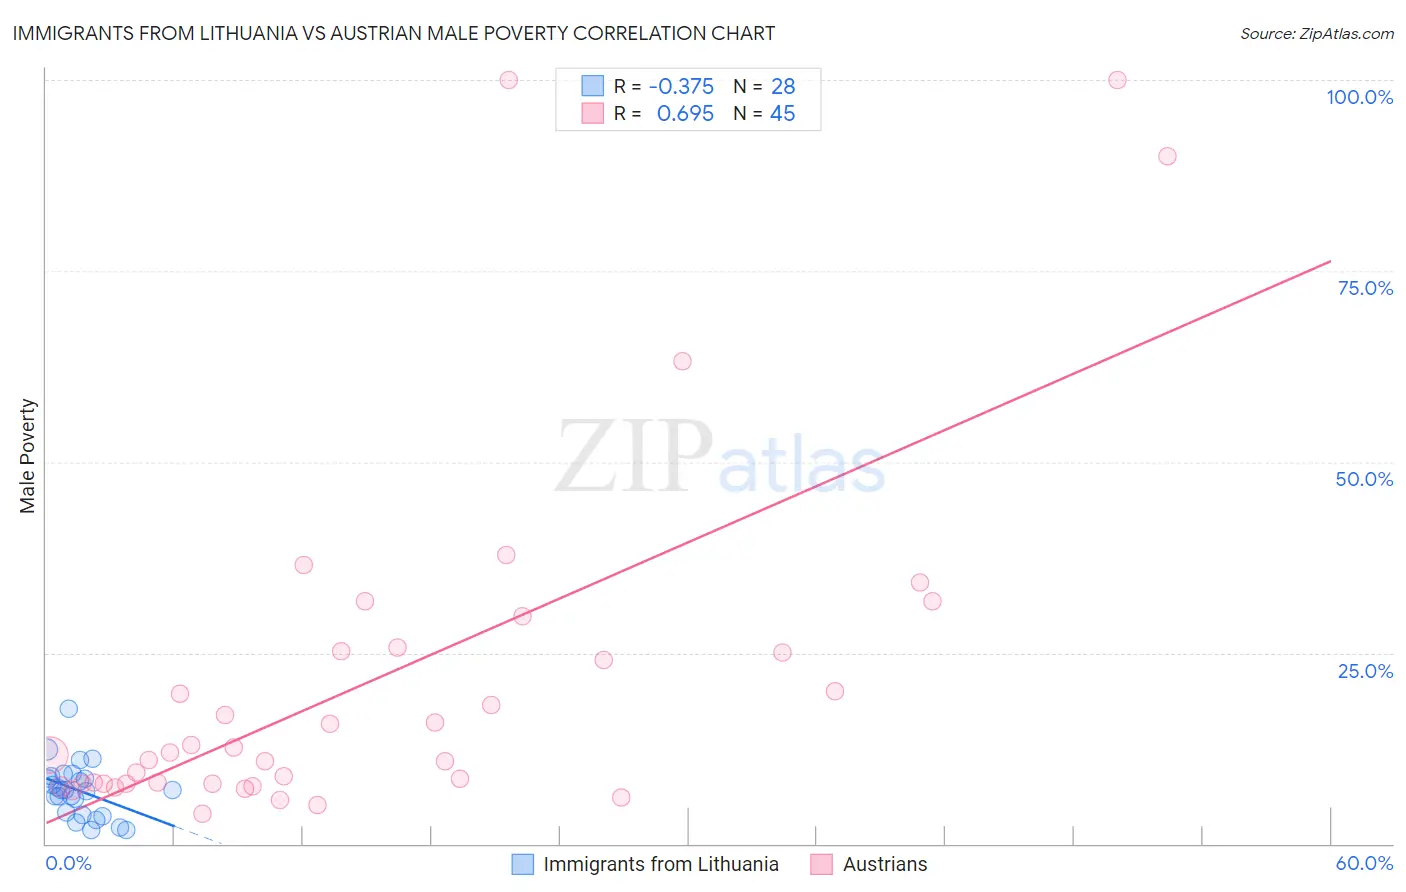
Immigrants from Lithuania vs Austrian Male Poverty Correlation Chart
The statistical analysis conducted on geographies consisting of 117,705,146 people shows a mild negative correlation between the proportion of Immigrants from Lithuania and poverty level among males in the United States with a correlation coefficient (R) of -0.375 and weighted average of 9.4%. Similarly, the statistical analysis conducted on geographies consisting of 451,474,043 people shows a significant positive correlation between the proportion of Austrians and poverty level among males in the United States with a correlation coefficient (R) of 0.695 and weighted average of 10.1%, a difference of 7.9%.
Male Poverty Correlation Summary
| Measurement | Immigrants from Lithuania | Austrian |
| Minimum | 1.8% | 4.0% |
| Maximum | 17.6% | 100.0% |
| Range | 15.8% | 96.0% |
| Mean | 7.0% | 21.7% |
| Median | 7.0% | 11.9% |
| Interquartile 25% (IQ1) | 3.9% | 7.9% |
| Interquartile 75% (IQ3) | 8.7% | 25.5% |
| Interquartile Range (IQR) | 4.8% | 17.6% |
| Standard Deviation (Sample) | 3.5% | 23.4% |
| Standard Deviation (Population) | 3.5% | 23.2% |
Similar Demographics by Male Poverty
Demographics Similar to Immigrants from Lithuania by Male Poverty
In terms of male poverty, the demographic groups most similar to Immigrants from Lithuania are Immigrants from Bolivia (9.4%, a difference of 0.12%), Bolivian (9.4%, a difference of 0.17%), Immigrants from North Macedonia (9.4%, a difference of 0.38%), Bhutanese (9.5%, a difference of 0.67%), and Bulgarian (9.3%, a difference of 0.82%).
| Demographics | Rating | Rank | Male Poverty |
| Assyrians/Chaldeans/Syriacs | 99.9 /100 | #6 | Exceptional 9.1% |
| Immigrants | Ireland | 99.9 /100 | #7 | Exceptional 9.1% |
| Filipinos | 99.9 /100 | #8 | Exceptional 9.2% |
| Immigrants | South Central Asia | 99.9 /100 | #9 | Exceptional 9.3% |
| Bulgarians | 99.9 /100 | #10 | Exceptional 9.3% |
| Bolivians | 99.9 /100 | #11 | Exceptional 9.4% |
| Immigrants | Bolivia | 99.9 /100 | #12 | Exceptional 9.4% |
| Immigrants | Lithuania | 99.9 /100 | #13 | Exceptional 9.4% |
| Immigrants | North Macedonia | 99.8 /100 | #14 | Exceptional 9.4% |
| Bhutanese | 99.8 /100 | #15 | Exceptional 9.5% |
| Luxembourgers | 99.8 /100 | #16 | Exceptional 9.5% |
| Norwegians | 99.8 /100 | #17 | Exceptional 9.5% |
| Lithuanians | 99.8 /100 | #18 | Exceptional 9.5% |
| Immigrants | Hong Kong | 99.7 /100 | #19 | Exceptional 9.6% |
| Latvians | 99.7 /100 | #20 | Exceptional 9.6% |
Demographics Similar to Austrians by Male Poverty
In terms of male poverty, the demographic groups most similar to Austrians are Ukrainian (10.1%, a difference of 0.020%), Immigrants from Italy (10.2%, a difference of 0.090%), Immigrants from Europe (10.1%, a difference of 0.11%), Slovak (10.2%, a difference of 0.13%), and Scandinavian (10.1%, a difference of 0.24%).
| Demographics | Rating | Rank | Male Poverty |
| Immigrants | Austria | 98.5 /100 | #54 | Exceptional 10.0% |
| Germans | 98.3 /100 | #55 | Exceptional 10.1% |
| Immigrants | Bulgaria | 98.2 /100 | #56 | Exceptional 10.1% |
| Estonians | 98.1 /100 | #57 | Exceptional 10.1% |
| Scandinavians | 98.0 /100 | #58 | Exceptional 10.1% |
| Immigrants | Europe | 97.9 /100 | #59 | Exceptional 10.1% |
| Ukrainians | 97.9 /100 | #60 | Exceptional 10.1% |
| Austrians | 97.8 /100 | #61 | Exceptional 10.1% |
| Immigrants | Italy | 97.8 /100 | #62 | Exceptional 10.2% |
| Slovaks | 97.7 /100 | #63 | Exceptional 10.2% |
| Swiss | 97.5 /100 | #64 | Exceptional 10.2% |
| Zimbabweans | 97.5 /100 | #65 | Exceptional 10.2% |
| Serbians | 97.5 /100 | #66 | Exceptional 10.2% |
| Immigrants | Netherlands | 97.3 /100 | #67 | Exceptional 10.2% |
| Immigrants | Sri Lanka | 97.2 /100 | #68 | Exceptional 10.2% |