Immigrants from Lithuania vs Austrian 9th Grade
COMPARE
Immigrants from Lithuania
Austrian
9th Grade
9th Grade Comparison
Immigrants from Lithuania
Austrians
95.8%
9TH GRADE
99.6/ 100
METRIC RATING
69th/ 347
METRIC RANK
96.0%
9TH GRADE
99.8/ 100
METRIC RATING
53rd/ 347
METRIC RANK
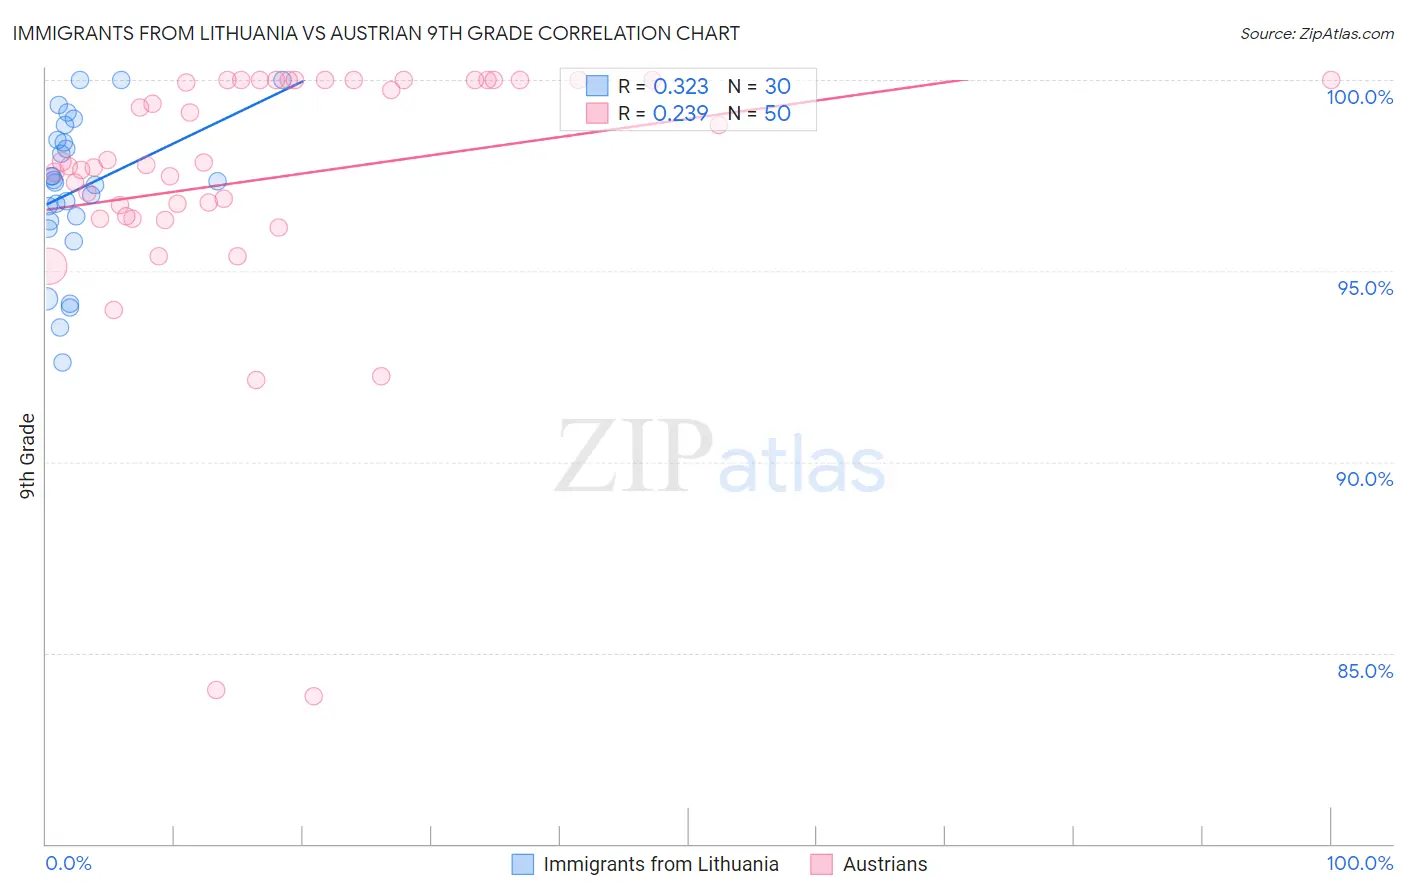
Immigrants from Lithuania vs Austrian 9th Grade Correlation Chart
The statistical analysis conducted on geographies consisting of 117,724,932 people shows a mild positive correlation between the proportion of Immigrants from Lithuania and percentage of population with at least 9th grade education in the United States with a correlation coefficient (R) of 0.323 and weighted average of 95.8%. Similarly, the statistical analysis conducted on geographies consisting of 452,082,820 people shows a weak positive correlation between the proportion of Austrians and percentage of population with at least 9th grade education in the United States with a correlation coefficient (R) of 0.239 and weighted average of 96.0%, a difference of 0.18%.
9th Grade Correlation Summary
| Measurement | Immigrants from Lithuania | Austrian |
| Minimum | 92.6% | 83.9% |
| Maximum | 100.0% | 100.0% |
| Range | 7.4% | 16.1% |
| Mean | 97.1% | 97.4% |
| Median | 97.3% | 97.8% |
| Interquartile 25% (IQ1) | 96.3% | 96.4% |
| Interquartile 75% (IQ3) | 98.4% | 100.0% |
| Interquartile Range (IQR) | 2.1% | 3.6% |
| Standard Deviation (Sample) | 2.0% | 3.4% |
| Standard Deviation (Population) | 1.9% | 3.4% |
Demographics Similar to Immigrants from Lithuania and Austrians by 9th Grade
In terms of 9th grade, the demographic groups most similar to Immigrants from Lithuania are Cypriot (95.8%, a difference of 0.0%), Immigrants from Ireland (95.8%, a difference of 0.0%), Immigrants from Netherlands (95.8%, a difference of 0.010%), Immigrants from Australia (95.8%, a difference of 0.020%), and Immigrants from Belgium (95.8%, a difference of 0.020%). Similarly, the demographic groups most similar to Austrians are Serbian (96.0%, a difference of 0.010%), Immigrants from Canada (96.0%, a difference of 0.010%), Immigrants from Northern Europe (96.0%, a difference of 0.020%), Immigrants from Austria (96.0%, a difference of 0.020%), and Immigrants from North America (96.0%, a difference of 0.030%).
| Demographics | Rating | Rank | 9th Grade |
| Immigrants | Northern Europe | 99.9 /100 | #51 | Exceptional 96.0% |
| Serbians | 99.9 /100 | #52 | Exceptional 96.0% |
| Austrians | 99.8 /100 | #53 | Exceptional 96.0% |
| Immigrants | Canada | 99.8 /100 | #54 | Exceptional 96.0% |
| Immigrants | Austria | 99.8 /100 | #55 | Exceptional 96.0% |
| Immigrants | North America | 99.8 /100 | #56 | Exceptional 96.0% |
| Macedonians | 99.8 /100 | #57 | Exceptional 96.0% |
| Aleuts | 99.8 /100 | #58 | Exceptional 96.0% |
| New Zealanders | 99.8 /100 | #59 | Exceptional 95.9% |
| Native Hawaiians | 99.8 /100 | #60 | Exceptional 95.9% |
| Sioux | 99.8 /100 | #61 | Exceptional 95.9% |
| Ukrainians | 99.7 /100 | #62 | Exceptional 95.9% |
| Canadians | 99.7 /100 | #63 | Exceptional 95.9% |
| Zimbabweans | 99.7 /100 | #64 | Exceptional 95.9% |
| Immigrants | England | 99.6 /100 | #65 | Exceptional 95.9% |
| Immigrants | Netherlands | 99.6 /100 | #66 | Exceptional 95.8% |
| Cypriots | 99.6 /100 | #67 | Exceptional 95.8% |
| Immigrants | Ireland | 99.6 /100 | #68 | Exceptional 95.8% |
| Immigrants | Lithuania | 99.6 /100 | #69 | Exceptional 95.8% |
| Immigrants | Australia | 99.5 /100 | #70 | Exceptional 95.8% |
| Immigrants | Belgium | 99.5 /100 | #71 | Exceptional 95.8% |