Immigrants from Lithuania vs Arab Unemployment Among Ages 30 to 34 years
COMPARE
Immigrants from Lithuania
Arab
Unemployment Among Ages 30 to 34 years
Unemployment Among Ages 30 to 34 years Comparison
Immigrants from Lithuania
Arabs
5.2%
UNEMPLOYMENT AMONG AGES 30 TO 34 YEARS
95.0/ 100
METRIC RATING
79th/ 347
METRIC RANK
5.4%
UNEMPLOYMENT AMONG AGES 30 TO 34 YEARS
57.7/ 100
METRIC RATING
163rd/ 347
METRIC RANK
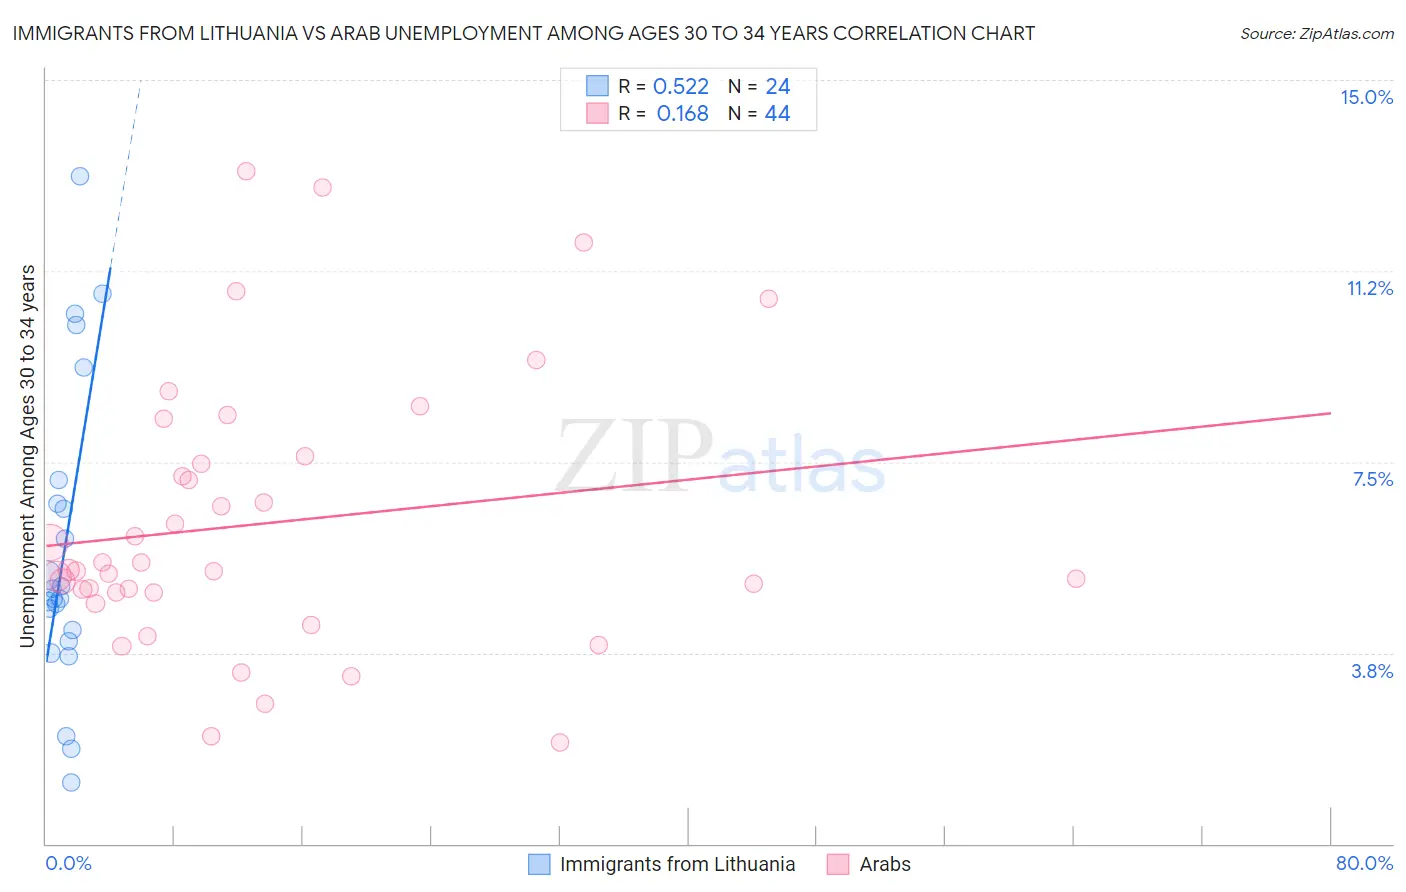
Immigrants from Lithuania vs Arab Unemployment Among Ages 30 to 34 years Correlation Chart
The statistical analysis conducted on geographies consisting of 114,688,670 people shows a substantial positive correlation between the proportion of Immigrants from Lithuania and unemployment rate among population between the ages 30 and 34 in the United States with a correlation coefficient (R) of 0.522 and weighted average of 5.2%. Similarly, the statistical analysis conducted on geographies consisting of 448,206,061 people shows a poor positive correlation between the proportion of Arabs and unemployment rate among population between the ages 30 and 34 in the United States with a correlation coefficient (R) of 0.168 and weighted average of 5.4%, a difference of 4.8%.
Unemployment Among Ages 30 to 34 years Correlation Summary
| Measurement | Immigrants from Lithuania | Arab |
| Minimum | 1.2% | 2.0% |
| Maximum | 13.1% | 13.2% |
| Range | 11.9% | 11.2% |
| Mean | 5.8% | 6.3% |
| Median | 4.9% | 5.4% |
| Interquartile 25% (IQ1) | 4.1% | 4.9% |
| Interquartile 75% (IQ3) | 6.9% | 7.5% |
| Interquartile Range (IQR) | 2.8% | 2.6% |
| Standard Deviation (Sample) | 3.0% | 2.7% |
| Standard Deviation (Population) | 2.9% | 2.6% |
Similar Demographics by Unemployment Among Ages 30 to 34 years
Demographics Similar to Immigrants from Lithuania by Unemployment Among Ages 30 to 34 years
In terms of unemployment among ages 30 to 34 years, the demographic groups most similar to Immigrants from Lithuania are Indonesian (5.2%, a difference of 0.050%), Immigrants from Indonesia (5.2%, a difference of 0.10%), Uruguayan (5.2%, a difference of 0.17%), Chilean (5.2%, a difference of 0.21%), and Scandinavian (5.2%, a difference of 0.25%).
| Demographics | Rating | Rank | Unemployment Among Ages 30 to 34 years |
| Immigrants | Moldova | 96.4 /100 | #72 | Exceptional 5.1% |
| Slovenes | 96.2 /100 | #73 | Exceptional 5.2% |
| Immigrants | Asia | 96.2 /100 | #74 | Exceptional 5.2% |
| Iranians | 96.0 /100 | #75 | Exceptional 5.2% |
| Scandinavians | 95.6 /100 | #76 | Exceptional 5.2% |
| Uruguayans | 95.4 /100 | #77 | Exceptional 5.2% |
| Indonesians | 95.1 /100 | #78 | Exceptional 5.2% |
| Immigrants | Lithuania | 95.0 /100 | #79 | Exceptional 5.2% |
| Immigrants | Indonesia | 94.7 /100 | #80 | Exceptional 5.2% |
| Chileans | 94.4 /100 | #81 | Exceptional 5.2% |
| Immigrants | Latvia | 94.2 /100 | #82 | Exceptional 5.2% |
| Immigrants | Korea | 94.1 /100 | #83 | Exceptional 5.2% |
| Immigrants | Uganda | 94.0 /100 | #84 | Exceptional 5.2% |
| Immigrants | Egypt | 93.9 /100 | #85 | Exceptional 5.2% |
| Immigrants | Australia | 93.5 /100 | #86 | Exceptional 5.2% |
Demographics Similar to Arabs by Unemployment Among Ages 30 to 34 years
In terms of unemployment among ages 30 to 34 years, the demographic groups most similar to Arabs are Basque (5.4%, a difference of 0.020%), Brazilian (5.4%, a difference of 0.040%), Austrian (5.4%, a difference of 0.090%), Welsh (5.4%, a difference of 0.10%), and Immigrants from Scotland (5.4%, a difference of 0.12%).
| Demographics | Rating | Rank | Unemployment Among Ages 30 to 34 years |
| Czechoslovakians | 63.7 /100 | #156 | Good 5.4% |
| Albanians | 63.7 /100 | #157 | Good 5.4% |
| Immigrants | Belarus | 62.7 /100 | #158 | Good 5.4% |
| Immigrants | Croatia | 61.0 /100 | #159 | Good 5.4% |
| Immigrants | Scotland | 59.3 /100 | #160 | Average 5.4% |
| Austrians | 59.0 /100 | #161 | Average 5.4% |
| Brazilians | 58.2 /100 | #162 | Average 5.4% |
| Arabs | 57.7 /100 | #163 | Average 5.4% |
| Basques | 57.3 /100 | #164 | Average 5.4% |
| Welsh | 56.3 /100 | #165 | Average 5.4% |
| Immigrants | Thailand | 55.6 /100 | #166 | Average 5.4% |
| English | 54.8 /100 | #167 | Average 5.4% |
| South Americans | 52.9 /100 | #168 | Average 5.4% |
| Immigrants | Israel | 52.9 /100 | #169 | Average 5.4% |
| Dutch | 52.6 /100 | #170 | Average 5.5% |