Immigrants from Liberia vs Dutch West Indian Unemployment Among Youth under 25 years
COMPARE
Immigrants from Liberia
Dutch West Indian
Unemployment Among Youth under 25 years
Unemployment Among Youth under 25 years Comparison
Immigrants from Liberia
Dutch West Indians
12.8%
UNEMPLOYMENT AMONG YOUTH UNDER 25 YEARS
0.0/ 100
METRIC RATING
270th/ 347
METRIC RANK
12.1%
UNEMPLOYMENT AMONG YOUTH UNDER 25 YEARS
1.1/ 100
METRIC RATING
240th/ 347
METRIC RANK
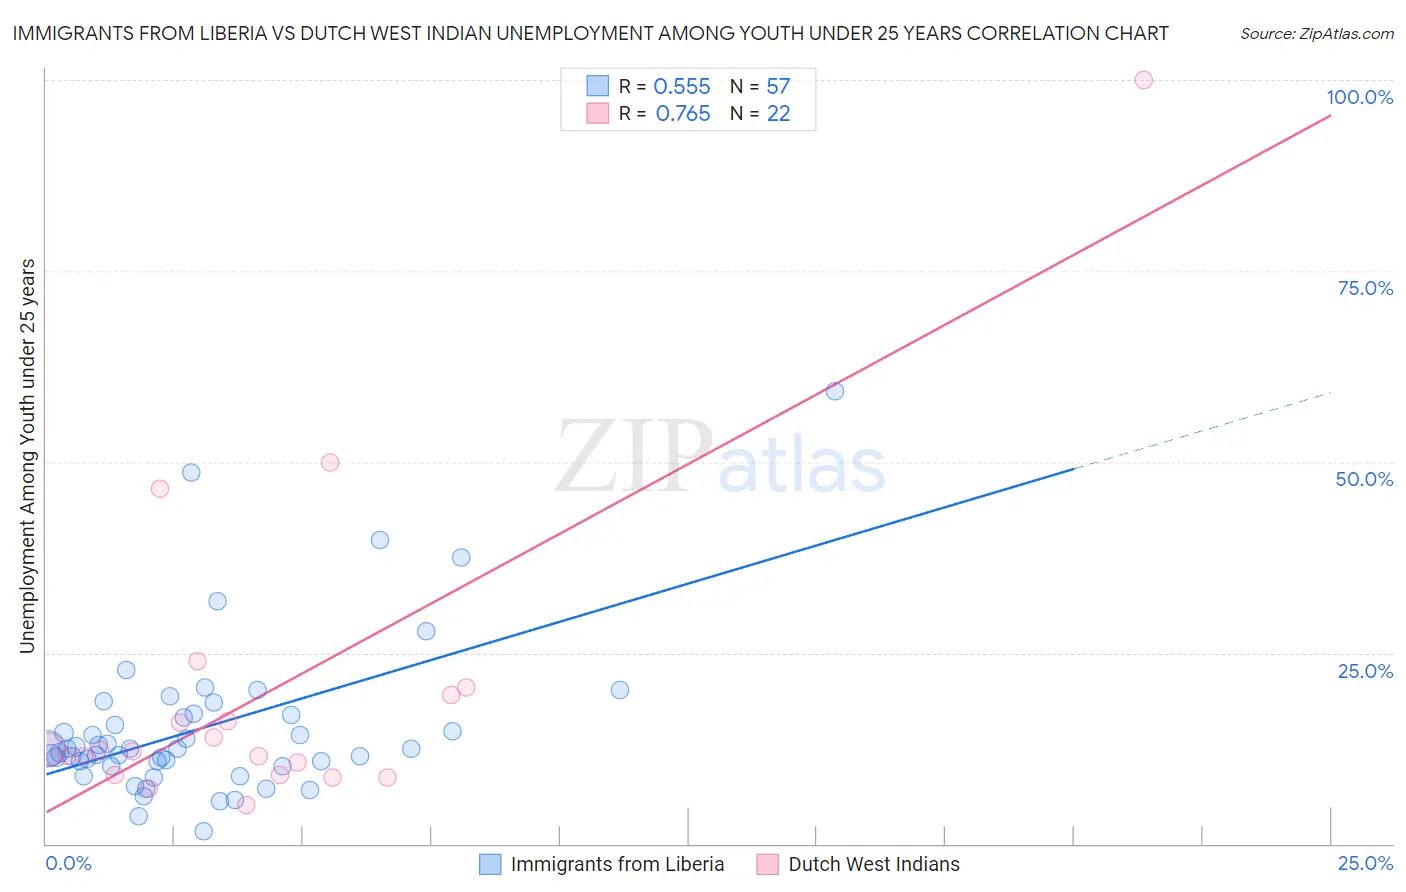
Immigrants from Liberia vs Dutch West Indian Unemployment Among Youth under 25 years Correlation Chart
The statistical analysis conducted on geographies consisting of 134,836,783 people shows a substantial positive correlation between the proportion of Immigrants from Liberia and unemployment rate among youth under the age of 25 in the United States with a correlation coefficient (R) of 0.555 and weighted average of 12.8%. Similarly, the statistical analysis conducted on geographies consisting of 85,012,533 people shows a strong positive correlation between the proportion of Dutch West Indians and unemployment rate among youth under the age of 25 in the United States with a correlation coefficient (R) of 0.765 and weighted average of 12.1%, a difference of 5.6%.
Unemployment Among Youth under 25 years Correlation Summary
| Measurement | Immigrants from Liberia | Dutch West Indian |
| Minimum | 1.7% | 5.1% |
| Maximum | 59.3% | 100.0% |
| Range | 57.6% | 94.9% |
| Mean | 15.2% | 19.8% |
| Median | 12.4% | 12.1% |
| Interquartile 25% (IQ1) | 10.5% | 9.1% |
| Interquartile 75% (IQ3) | 17.0% | 19.5% |
| Interquartile Range (IQR) | 6.5% | 10.4% |
| Standard Deviation (Sample) | 10.4% | 21.2% |
| Standard Deviation (Population) | 10.3% | 20.7% |
Similar Demographics by Unemployment Among Youth under 25 years
Demographics Similar to Immigrants from Liberia by Unemployment Among Youth under 25 years
In terms of unemployment among youth under 25 years, the demographic groups most similar to Immigrants from Liberia are Immigrants from Bahamas (12.9%, a difference of 0.53%), Cape Verdean (12.9%, a difference of 0.75%), Nigerian (13.0%, a difference of 1.1%), Kiowa (12.7%, a difference of 1.1%), and Tlingit-Haida (12.7%, a difference of 1.3%).
| Demographics | Rating | Rank | Unemployment Among Youth under 25 years |
| Cree | 0.1 /100 | #263 | Tragic 12.4% |
| Puget Sound Salish | 0.1 /100 | #264 | Tragic 12.5% |
| Nepalese | 0.0 /100 | #265 | Tragic 12.5% |
| Immigrants | Latin America | 0.0 /100 | #266 | Tragic 12.6% |
| Sub-Saharan Africans | 0.0 /100 | #267 | Tragic 12.6% |
| Tlingit-Haida | 0.0 /100 | #268 | Tragic 12.7% |
| Kiowa | 0.0 /100 | #269 | Tragic 12.7% |
| Immigrants | Liberia | 0.0 /100 | #270 | Tragic 12.8% |
| Immigrants | Bahamas | 0.0 /100 | #271 | Tragic 12.9% |
| Cape Verdeans | 0.0 /100 | #272 | Tragic 12.9% |
| Nigerians | 0.0 /100 | #273 | Tragic 13.0% |
| Immigrants | Nigeria | 0.0 /100 | #274 | Tragic 13.0% |
| Bermudans | 0.0 /100 | #275 | Tragic 13.0% |
| Immigrants | Uzbekistan | 0.0 /100 | #276 | Tragic 13.1% |
| Bahamians | 0.0 /100 | #277 | Tragic 13.1% |
Demographics Similar to Dutch West Indians by Unemployment Among Youth under 25 years
In terms of unemployment among youth under 25 years, the demographic groups most similar to Dutch West Indians are Immigrants from Albania (12.1%, a difference of 0.020%), Immigrants from Africa (12.1%, a difference of 0.030%), Albanian (12.1%, a difference of 0.080%), Native Hawaiian (12.1%, a difference of 0.15%), and Immigrants (12.1%, a difference of 0.17%).
| Demographics | Rating | Rank | Unemployment Among Youth under 25 years |
| South American Indians | 1.6 /100 | #233 | Tragic 12.1% |
| Guatemalans | 1.4 /100 | #234 | Tragic 12.1% |
| Immigrants | Guatemala | 1.4 /100 | #235 | Tragic 12.1% |
| Immigrants | Immigrants | 1.3 /100 | #236 | Tragic 12.1% |
| Native Hawaiians | 1.3 /100 | #237 | Tragic 12.1% |
| Albanians | 1.2 /100 | #238 | Tragic 12.1% |
| Immigrants | Africa | 1.1 /100 | #239 | Tragic 12.1% |
| Dutch West Indians | 1.1 /100 | #240 | Tragic 12.1% |
| Immigrants | Albania | 1.1 /100 | #241 | Tragic 12.1% |
| Immigrants | Western Asia | 0.8 /100 | #242 | Tragic 12.2% |
| Immigrants | Azores | 0.6 /100 | #243 | Tragic 12.2% |
| Alaskan Athabascans | 0.6 /100 | #244 | Tragic 12.2% |
| Spanish Americans | 0.6 /100 | #245 | Tragic 12.2% |
| Immigrants | Honduras | 0.6 /100 | #246 | Tragic 12.2% |
| Immigrants | Greece | 0.6 /100 | #247 | Tragic 12.2% |