Immigrants from Lebanon vs Immigrants from Korea Female Poverty Among 18-24 Year Olds
COMPARE
Immigrants from Lebanon
Immigrants from Korea
Female Poverty Among 18-24 Year Olds
Female Poverty Among 18-24 Year Olds Comparison
Immigrants from Lebanon
Immigrants from Korea
19.8%
FEMALE POVERTY AMONG 18-24 YEAR OLDS
75.3/ 100
METRIC RATING
158th/ 347
METRIC RANK
18.6%
FEMALE POVERTY AMONG 18-24 YEAR OLDS
99.8/ 100
METRIC RATING
67th/ 347
METRIC RANK
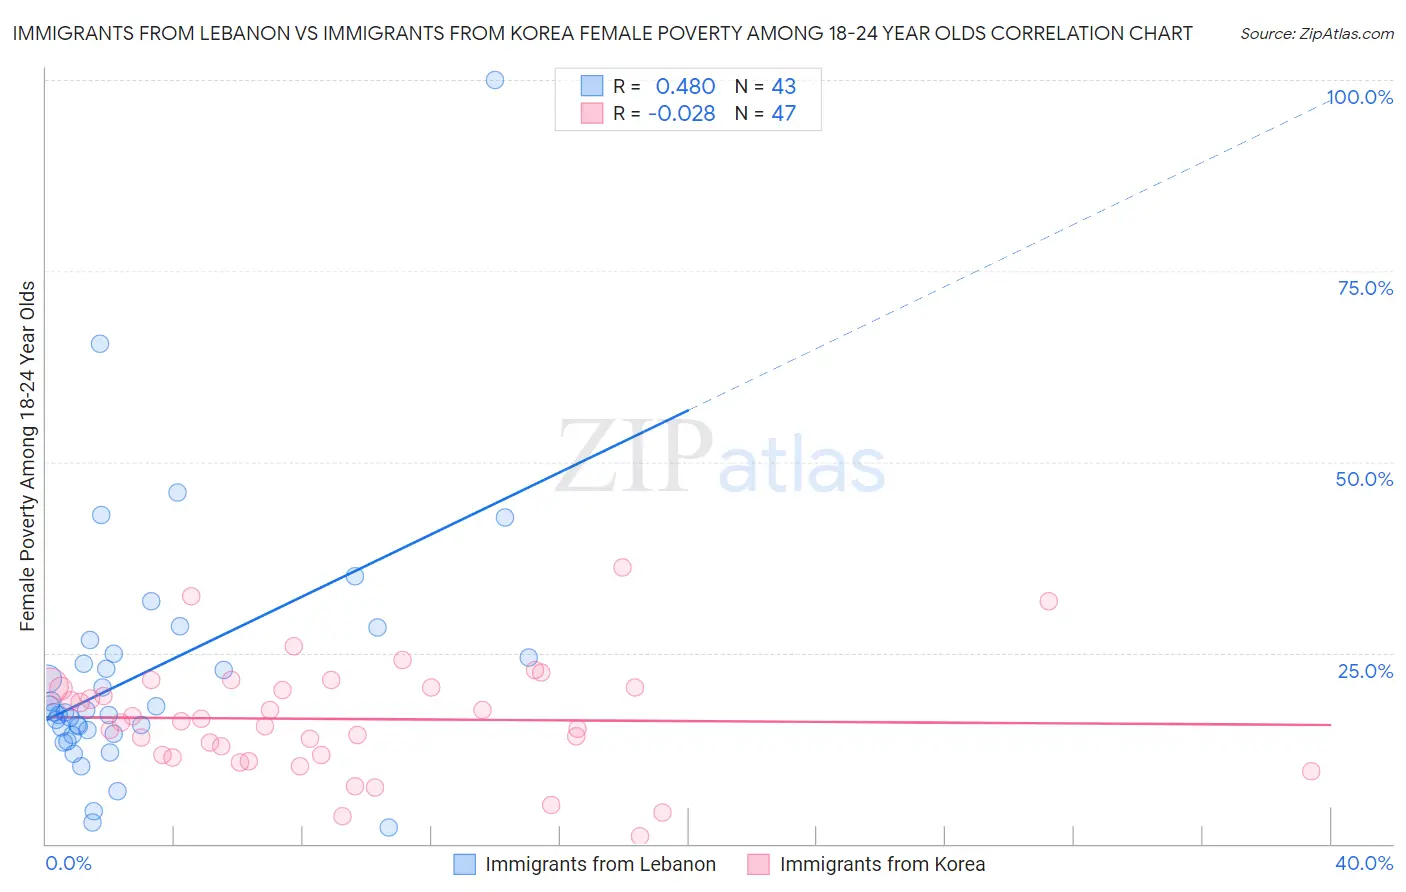
Immigrants from Lebanon vs Immigrants from Korea Female Poverty Among 18-24 Year Olds Correlation Chart
The statistical analysis conducted on geographies consisting of 214,316,536 people shows a moderate positive correlation between the proportion of Immigrants from Lebanon and poverty level among females between the ages 18 and 24 in the United States with a correlation coefficient (R) of 0.480 and weighted average of 19.8%. Similarly, the statistical analysis conducted on geographies consisting of 404,235,363 people shows no correlation between the proportion of Immigrants from Korea and poverty level among females between the ages 18 and 24 in the United States with a correlation coefficient (R) of -0.028 and weighted average of 18.6%, a difference of 6.5%.
Female Poverty Among 18-24 Year Olds Correlation Summary
| Measurement | Immigrants from Lebanon | Immigrants from Korea |
| Minimum | 2.1% | 0.99% |
| Maximum | 100.0% | 36.2% |
| Range | 97.9% | 35.2% |
| Mean | 22.4% | 16.3% |
| Median | 17.2% | 16.0% |
| Interquartile 25% (IQ1) | 14.4% | 11.6% |
| Interquartile 75% (IQ3) | 24.8% | 20.5% |
| Interquartile Range (IQR) | 10.5% | 8.9% |
| Standard Deviation (Sample) | 17.0% | 7.2% |
| Standard Deviation (Population) | 16.8% | 7.2% |
Similar Demographics by Female Poverty Among 18-24 Year Olds
Demographics Similar to Immigrants from Lebanon by Female Poverty Among 18-24 Year Olds
In terms of female poverty among 18-24 year olds, the demographic groups most similar to Immigrants from Lebanon are Danish (19.8%, a difference of 0.020%), Trinidadian and Tobagonian (19.8%, a difference of 0.060%), Immigrants from Belgium (19.8%, a difference of 0.080%), Pakistani (19.8%, a difference of 0.080%), and Immigrants from Belize (19.8%, a difference of 0.080%).
| Demographics | Rating | Rank | Female Poverty Among 18-24 Year Olds |
| Immigrants | Eastern Asia | 79.7 /100 | #151 | Good 19.8% |
| Yugoslavians | 79.0 /100 | #152 | Good 19.8% |
| Immigrants | Japan | 78.1 /100 | #153 | Good 19.8% |
| Immigrants | Zimbabwe | 76.7 /100 | #154 | Good 19.8% |
| Hungarians | 76.6 /100 | #155 | Good 19.8% |
| Immigrants | Belgium | 76.4 /100 | #156 | Good 19.8% |
| Danes | 75.5 /100 | #157 | Good 19.8% |
| Immigrants | Lebanon | 75.3 /100 | #158 | Good 19.8% |
| Trinidadians and Tobagonians | 74.4 /100 | #159 | Good 19.8% |
| Pakistanis | 74.1 /100 | #160 | Good 19.8% |
| Immigrants | Belize | 74.1 /100 | #161 | Good 19.8% |
| French Canadians | 73.0 /100 | #162 | Good 19.9% |
| Malaysians | 72.7 /100 | #163 | Good 19.9% |
| Central Americans | 70.0 /100 | #164 | Good 19.9% |
| Eastern Europeans | 69.3 /100 | #165 | Good 19.9% |
Demographics Similar to Immigrants from Korea by Female Poverty Among 18-24 Year Olds
In terms of female poverty among 18-24 year olds, the demographic groups most similar to Immigrants from Korea are Brazilian (18.6%, a difference of 0.030%), Immigrants from Bulgaria (18.6%, a difference of 0.15%), Jordanian (18.6%, a difference of 0.17%), Immigrants from Costa Rica (18.7%, a difference of 0.26%), and Immigrants from Haiti (18.7%, a difference of 0.32%).
| Demographics | Rating | Rank | Female Poverty Among 18-24 Year Olds |
| Immigrants | Brazil | 99.8 /100 | #60 | Exceptional 18.5% |
| Immigrants | Albania | 99.8 /100 | #61 | Exceptional 18.5% |
| Greeks | 99.8 /100 | #62 | Exceptional 18.5% |
| Immigrants | Belarus | 99.8 /100 | #63 | Exceptional 18.5% |
| Immigrants | Asia | 99.8 /100 | #64 | Exceptional 18.6% |
| Immigrants | Scotland | 99.8 /100 | #65 | Exceptional 18.6% |
| Jordanians | 99.8 /100 | #66 | Exceptional 18.6% |
| Immigrants | Korea | 99.8 /100 | #67 | Exceptional 18.6% |
| Brazilians | 99.8 /100 | #68 | Exceptional 18.6% |
| Immigrants | Bulgaria | 99.7 /100 | #69 | Exceptional 18.6% |
| Immigrants | Costa Rica | 99.7 /100 | #70 | Exceptional 18.7% |
| Immigrants | Haiti | 99.7 /100 | #71 | Exceptional 18.7% |
| Armenians | 99.7 /100 | #72 | Exceptional 18.7% |
| Lithuanians | 99.7 /100 | #73 | Exceptional 18.7% |
| Hawaiians | 99.6 /100 | #74 | Exceptional 18.7% |