Immigrants from Lebanon vs Immigrants from Afghanistan Female Poverty Among 18-24 Year Olds
COMPARE
Immigrants from Lebanon
Immigrants from Afghanistan
Female Poverty Among 18-24 Year Olds
Female Poverty Among 18-24 Year Olds Comparison
Immigrants from Lebanon
Immigrants from Afghanistan
19.8%
FEMALE POVERTY AMONG 18-24 YEAR OLDS
75.3/ 100
METRIC RATING
158th/ 347
METRIC RANK
19.1%
FEMALE POVERTY AMONG 18-24 YEAR OLDS
98.0/ 100
METRIC RATING
104th/ 347
METRIC RANK
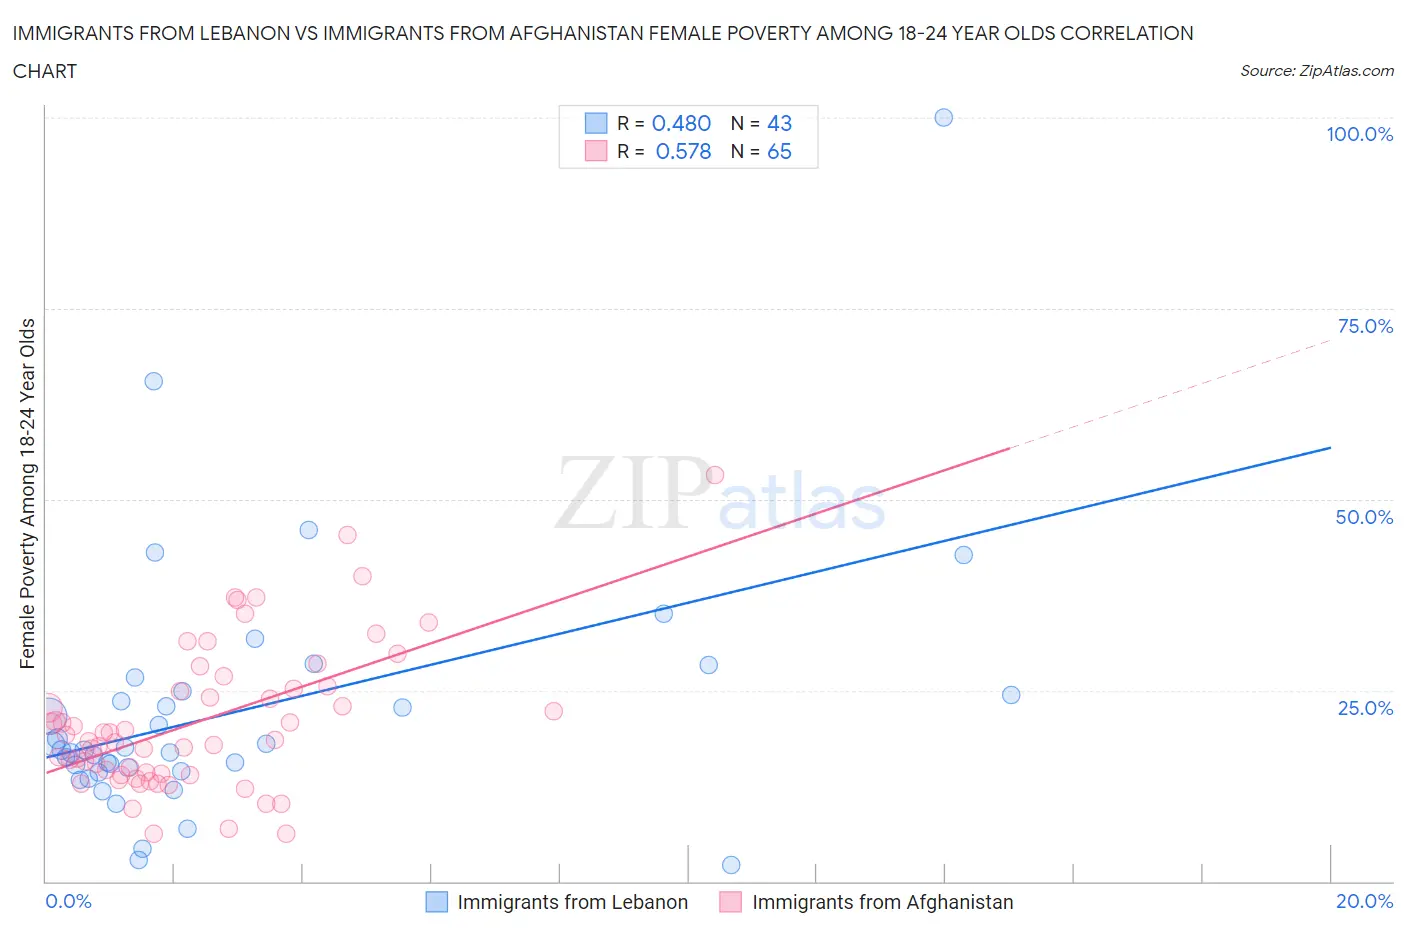
Immigrants from Lebanon vs Immigrants from Afghanistan Female Poverty Among 18-24 Year Olds Correlation Chart
The statistical analysis conducted on geographies consisting of 214,316,536 people shows a moderate positive correlation between the proportion of Immigrants from Lebanon and poverty level among females between the ages 18 and 24 in the United States with a correlation coefficient (R) of 0.480 and weighted average of 19.8%. Similarly, the statistical analysis conducted on geographies consisting of 146,633,346 people shows a substantial positive correlation between the proportion of Immigrants from Afghanistan and poverty level among females between the ages 18 and 24 in the United States with a correlation coefficient (R) of 0.578 and weighted average of 19.1%, a difference of 3.5%.
Female Poverty Among 18-24 Year Olds Correlation Summary
| Measurement | Immigrants from Lebanon | Immigrants from Afghanistan |
| Minimum | 2.1% | 6.2% |
| Maximum | 100.0% | 53.1% |
| Range | 97.9% | 46.9% |
| Mean | 22.4% | 20.9% |
| Median | 17.2% | 18.4% |
| Interquartile 25% (IQ1) | 14.4% | 14.0% |
| Interquartile 75% (IQ3) | 24.8% | 25.4% |
| Interquartile Range (IQR) | 10.5% | 11.4% |
| Standard Deviation (Sample) | 17.0% | 9.5% |
| Standard Deviation (Population) | 16.8% | 9.4% |
Similar Demographics by Female Poverty Among 18-24 Year Olds
Demographics Similar to Immigrants from Lebanon by Female Poverty Among 18-24 Year Olds
In terms of female poverty among 18-24 year olds, the demographic groups most similar to Immigrants from Lebanon are Danish (19.8%, a difference of 0.020%), Trinidadian and Tobagonian (19.8%, a difference of 0.060%), Immigrants from Belgium (19.8%, a difference of 0.080%), Pakistani (19.8%, a difference of 0.080%), and Immigrants from Belize (19.8%, a difference of 0.080%).
| Demographics | Rating | Rank | Female Poverty Among 18-24 Year Olds |
| Immigrants | Eastern Asia | 79.7 /100 | #151 | Good 19.8% |
| Yugoslavians | 79.0 /100 | #152 | Good 19.8% |
| Immigrants | Japan | 78.1 /100 | #153 | Good 19.8% |
| Immigrants | Zimbabwe | 76.7 /100 | #154 | Good 19.8% |
| Hungarians | 76.6 /100 | #155 | Good 19.8% |
| Immigrants | Belgium | 76.4 /100 | #156 | Good 19.8% |
| Danes | 75.5 /100 | #157 | Good 19.8% |
| Immigrants | Lebanon | 75.3 /100 | #158 | Good 19.8% |
| Trinidadians and Tobagonians | 74.4 /100 | #159 | Good 19.8% |
| Pakistanis | 74.1 /100 | #160 | Good 19.8% |
| Immigrants | Belize | 74.1 /100 | #161 | Good 19.8% |
| French Canadians | 73.0 /100 | #162 | Good 19.9% |
| Malaysians | 72.7 /100 | #163 | Good 19.9% |
| Central Americans | 70.0 /100 | #164 | Good 19.9% |
| Eastern Europeans | 69.3 /100 | #165 | Good 19.9% |
Demographics Similar to Immigrants from Afghanistan by Female Poverty Among 18-24 Year Olds
In terms of female poverty among 18-24 year olds, the demographic groups most similar to Immigrants from Afghanistan are Serbian (19.1%, a difference of 0.040%), Immigrants from Caribbean (19.1%, a difference of 0.080%), Immigrants from Ecuador (19.2%, a difference of 0.090%), Ecuadorian (19.1%, a difference of 0.11%), and Immigrants from Sierra Leone (19.2%, a difference of 0.12%).
| Demographics | Rating | Rank | Female Poverty Among 18-24 Year Olds |
| Salvadorans | 98.4 /100 | #97 | Exceptional 19.1% |
| Immigrants | Jordan | 98.4 /100 | #98 | Exceptional 19.1% |
| Immigrants | Czechoslovakia | 98.3 /100 | #99 | Exceptional 19.1% |
| Chileans | 98.3 /100 | #100 | Exceptional 19.1% |
| Ecuadorians | 98.1 /100 | #101 | Exceptional 19.1% |
| Immigrants | Caribbean | 98.1 /100 | #102 | Exceptional 19.1% |
| Serbians | 98.0 /100 | #103 | Exceptional 19.1% |
| Immigrants | Afghanistan | 98.0 /100 | #104 | Exceptional 19.1% |
| Immigrants | Ecuador | 97.8 /100 | #105 | Exceptional 19.2% |
| Immigrants | Sierra Leone | 97.8 /100 | #106 | Exceptional 19.2% |
| Immigrants | Sri Lanka | 97.5 /100 | #107 | Exceptional 19.2% |
| Immigrants | Uzbekistan | 97.3 /100 | #108 | Exceptional 19.2% |
| Immigrants | Syria | 97.2 /100 | #109 | Exceptional 19.2% |
| Laotians | 97.1 /100 | #110 | Exceptional 19.2% |
| Immigrants | Serbia | 97.1 /100 | #111 | Exceptional 19.2% |