Immigrants from Latin America vs Slovene Single Female Poverty
COMPARE
Immigrants from Latin America
Slovene
Single Female Poverty
Single Female Poverty Comparison
Immigrants from Latin America
Slovenes
23.7%
SINGLE FEMALE POVERTY
0.0/ 100
METRIC RATING
280th/ 347
METRIC RANK
20.3%
SINGLE FEMALE POVERTY
90.5/ 100
METRIC RATING
138th/ 347
METRIC RANK
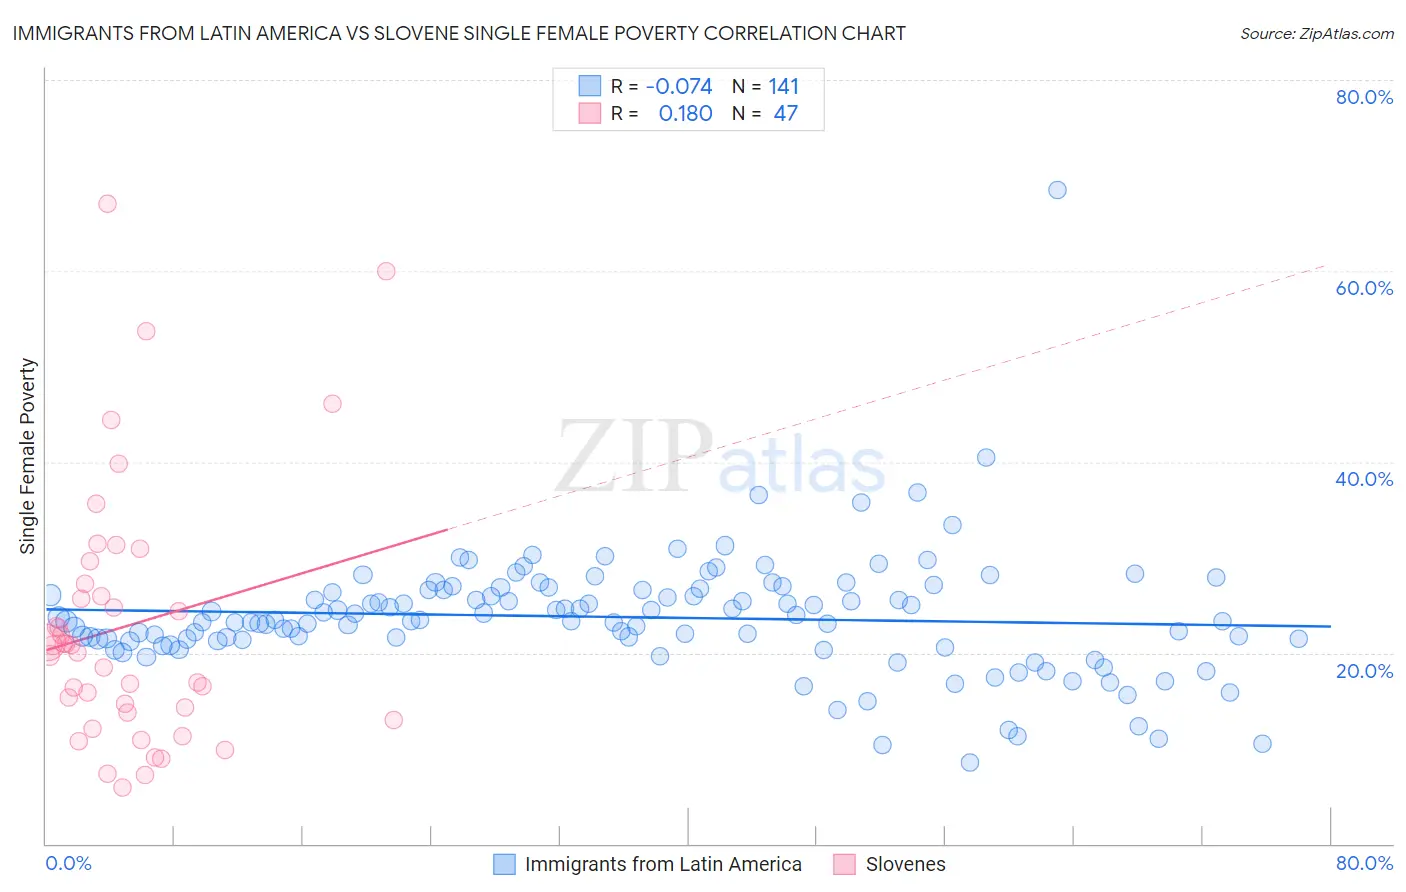
Immigrants from Latin America vs Slovene Single Female Poverty Correlation Chart
The statistical analysis conducted on geographies consisting of 541,789,164 people shows a slight negative correlation between the proportion of Immigrants from Latin America and poverty level among single females in the United States with a correlation coefficient (R) of -0.074 and weighted average of 23.7%. Similarly, the statistical analysis conducted on geographies consisting of 257,900,549 people shows a poor positive correlation between the proportion of Slovenes and poverty level among single females in the United States with a correlation coefficient (R) of 0.180 and weighted average of 20.3%, a difference of 17.0%.
Single Female Poverty Correlation Summary
| Measurement | Immigrants from Latin America | Slovene |
| Minimum | 8.5% | 5.9% |
| Maximum | 68.5% | 67.0% |
| Range | 60.0% | 61.1% |
| Mean | 23.7% | 22.9% |
| Median | 23.4% | 20.8% |
| Interquartile 25% (IQ1) | 21.3% | 13.8% |
| Interquartile 75% (IQ3) | 26.5% | 27.3% |
| Interquartile Range (IQR) | 5.2% | 13.5% |
| Standard Deviation (Sample) | 6.4% | 13.6% |
| Standard Deviation (Population) | 6.4% | 13.5% |
Similar Demographics by Single Female Poverty
Demographics Similar to Immigrants from Latin America by Single Female Poverty
In terms of single female poverty, the demographic groups most similar to Immigrants from Latin America are Alaskan Athabascan (23.6%, a difference of 0.49%), Immigrants from Zaire (23.8%, a difference of 0.51%), Nonimmigrants (23.6%, a difference of 0.53%), Guatemalan (23.8%, a difference of 0.56%), and Pennsylvania German (23.6%, a difference of 0.60%).
| Demographics | Rating | Rank | Single Female Poverty |
| Alaska Natives | 0.1 /100 | #273 | Tragic 23.3% |
| Marshallese | 0.1 /100 | #274 | Tragic 23.3% |
| Mexican American Indians | 0.1 /100 | #275 | Tragic 23.4% |
| Immigrants | Azores | 0.0 /100 | #276 | Tragic 23.5% |
| Pennsylvania Germans | 0.0 /100 | #277 | Tragic 23.6% |
| Immigrants | Nonimmigrants | 0.0 /100 | #278 | Tragic 23.6% |
| Alaskan Athabascans | 0.0 /100 | #279 | Tragic 23.6% |
| Immigrants | Latin America | 0.0 /100 | #280 | Tragic 23.7% |
| Immigrants | Zaire | 0.0 /100 | #281 | Tragic 23.8% |
| Guatemalans | 0.0 /100 | #282 | Tragic 23.8% |
| German Russians | 0.0 /100 | #283 | Tragic 23.9% |
| Immigrants | Dominica | 0.0 /100 | #284 | Tragic 23.9% |
| Immigrants | Guatemala | 0.0 /100 | #285 | Tragic 24.1% |
| Cree | 0.0 /100 | #286 | Tragic 24.1% |
| Bangladeshis | 0.0 /100 | #287 | Tragic 24.2% |
Demographics Similar to Slovenes by Single Female Poverty
In terms of single female poverty, the demographic groups most similar to Slovenes are Immigrants from Kuwait (20.3%, a difference of 0.010%), Syrian (20.3%, a difference of 0.010%), Immigrants from Nepal (20.3%, a difference of 0.030%), Immigrants from Canada (20.2%, a difference of 0.14%), and Immigrants from Iraq (20.2%, a difference of 0.15%).
| Demographics | Rating | Rank | Single Female Poverty |
| Pakistanis | 92.1 /100 | #131 | Exceptional 20.2% |
| Uruguayans | 92.1 /100 | #132 | Exceptional 20.2% |
| Immigrants | England | 91.9 /100 | #133 | Exceptional 20.2% |
| Immigrants | Venezuela | 91.5 /100 | #134 | Exceptional 20.2% |
| Immigrants | Iraq | 91.2 /100 | #135 | Exceptional 20.2% |
| Immigrants | Canada | 91.2 /100 | #136 | Exceptional 20.2% |
| Immigrants | Nepal | 90.6 /100 | #137 | Exceptional 20.3% |
| Slovenes | 90.5 /100 | #138 | Exceptional 20.3% |
| Immigrants | Kuwait | 90.4 /100 | #139 | Exceptional 20.3% |
| Syrians | 90.4 /100 | #140 | Exceptional 20.3% |
| Immigrants | North America | 89.5 /100 | #141 | Excellent 20.3% |
| Immigrants | Uganda | 89.1 /100 | #142 | Excellent 20.3% |
| Australians | 88.4 /100 | #143 | Excellent 20.3% |
| Immigrants | Uzbekistan | 88.3 /100 | #144 | Excellent 20.3% |
| Austrians | 85.8 /100 | #145 | Excellent 20.4% |