Immigrants from Latin America vs Colombian Female Poverty
COMPARE
Immigrants from Latin America
Colombian
Female Poverty
Female Poverty Comparison
Immigrants from Latin America
Colombians
16.4%
FEMALE POVERTY
0.0/ 100
METRIC RATING
293rd/ 347
METRIC RANK
13.4%
FEMALE POVERTY
55.7/ 100
METRIC RATING
170th/ 347
METRIC RANK
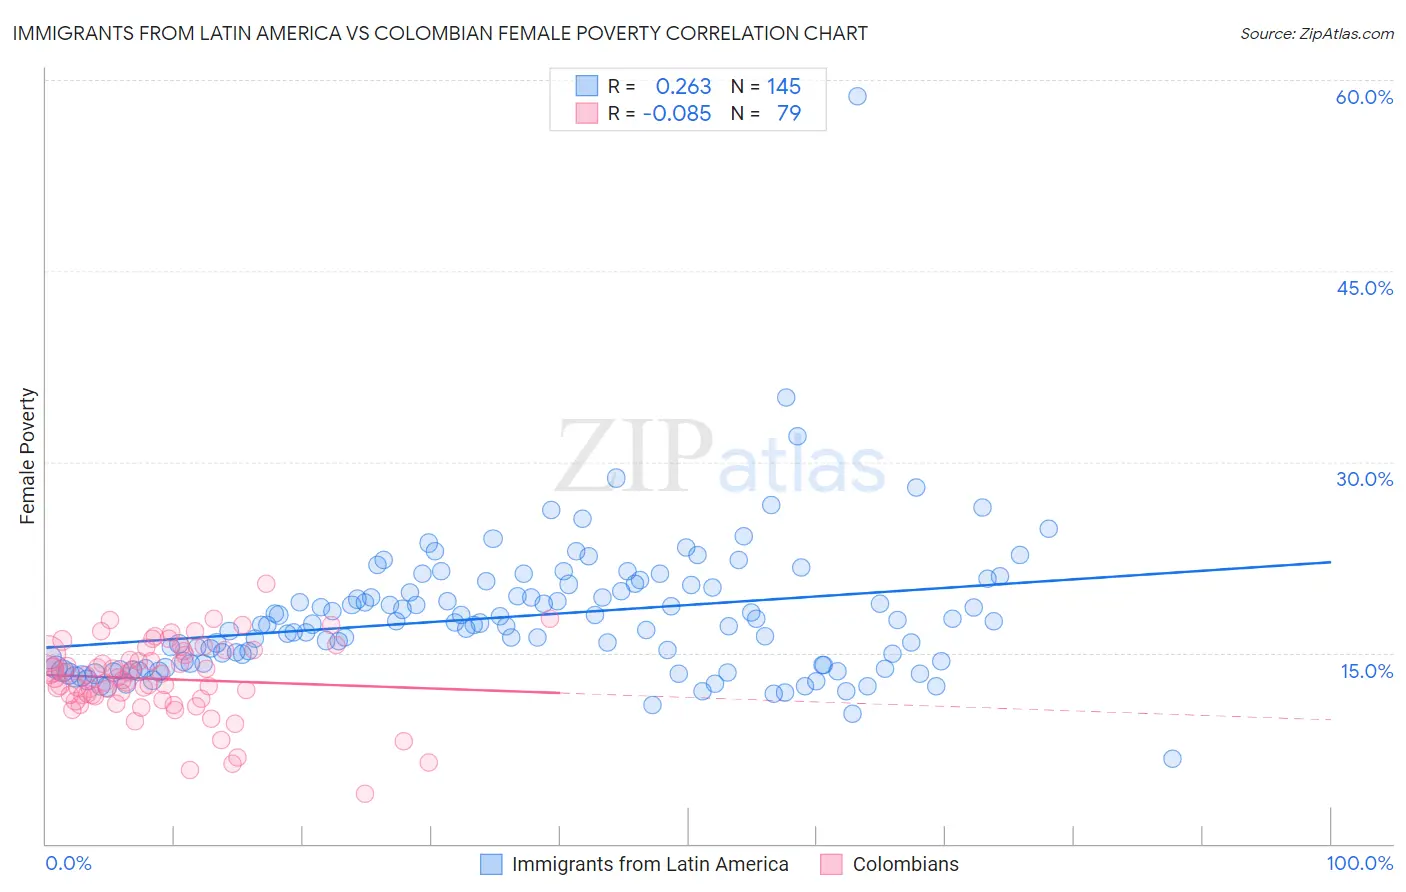
Immigrants from Latin America vs Colombian Female Poverty Correlation Chart
The statistical analysis conducted on geographies consisting of 557,630,334 people shows a weak positive correlation between the proportion of Immigrants from Latin America and poverty level among females in the United States with a correlation coefficient (R) of 0.263 and weighted average of 16.4%. Similarly, the statistical analysis conducted on geographies consisting of 419,235,280 people shows a slight negative correlation between the proportion of Colombians and poverty level among females in the United States with a correlation coefficient (R) of -0.085 and weighted average of 13.4%, a difference of 22.9%.
Female Poverty Correlation Summary
| Measurement | Immigrants from Latin America | Colombian |
| Minimum | 6.7% | 4.0% |
| Maximum | 58.7% | 20.5% |
| Range | 52.1% | 16.5% |
| Mean | 17.9% | 12.9% |
| Median | 17.2% | 13.1% |
| Interquartile 25% (IQ1) | 14.0% | 11.4% |
| Interquartile 75% (IQ3) | 20.2% | 15.1% |
| Interquartile Range (IQR) | 6.2% | 3.7% |
| Standard Deviation (Sample) | 5.5% | 3.0% |
| Standard Deviation (Population) | 5.5% | 3.0% |
Similar Demographics by Female Poverty
Demographics Similar to Immigrants from Latin America by Female Poverty
In terms of female poverty, the demographic groups most similar to Immigrants from Latin America are Immigrants from Cabo Verde (16.4%, a difference of 0.030%), Immigrants from Zaire (16.4%, a difference of 0.060%), Yaqui (16.4%, a difference of 0.070%), Senegalese (16.5%, a difference of 0.11%), and Immigrants from Senegal (16.5%, a difference of 0.13%).
| Demographics | Rating | Rank | Female Poverty |
| Inupiat | 0.0 /100 | #286 | Tragic 16.2% |
| Immigrants | Belize | 0.0 /100 | #287 | Tragic 16.3% |
| Indonesians | 0.0 /100 | #288 | Tragic 16.4% |
| Blackfeet | 0.0 /100 | #289 | Tragic 16.4% |
| Immigrants | Bangladesh | 0.0 /100 | #290 | Tragic 16.4% |
| Yaqui | 0.0 /100 | #291 | Tragic 16.4% |
| Immigrants | Zaire | 0.0 /100 | #292 | Tragic 16.4% |
| Immigrants | Latin America | 0.0 /100 | #293 | Tragic 16.4% |
| Immigrants | Cabo Verde | 0.0 /100 | #294 | Tragic 16.4% |
| Senegalese | 0.0 /100 | #295 | Tragic 16.5% |
| Immigrants | Senegal | 0.0 /100 | #296 | Tragic 16.5% |
| Mexicans | 0.0 /100 | #297 | Tragic 16.5% |
| Somalis | 0.0 /100 | #298 | Tragic 16.6% |
| Hispanics or Latinos | 0.0 /100 | #299 | Tragic 16.6% |
| Bahamians | 0.0 /100 | #300 | Tragic 16.6% |
Demographics Similar to Colombians by Female Poverty
In terms of female poverty, the demographic groups most similar to Colombians are Lebanese (13.4%, a difference of 0.020%), Aleut (13.4%, a difference of 0.10%), White/Caucasian (13.4%, a difference of 0.11%), Immigrants from Chile (13.3%, a difference of 0.16%), and Mongolian (13.4%, a difference of 0.21%).
| Demographics | Rating | Rank | Female Poverty |
| Immigrants | Albania | 62.4 /100 | #163 | Good 13.3% |
| Ethiopians | 62.3 /100 | #164 | Good 13.3% |
| Scotch-Irish | 62.1 /100 | #165 | Good 13.3% |
| Immigrants | Oceania | 59.7 /100 | #166 | Average 13.3% |
| Immigrants | Chile | 57.4 /100 | #167 | Average 13.3% |
| Aleuts | 56.7 /100 | #168 | Average 13.4% |
| Lebanese | 55.9 /100 | #169 | Average 13.4% |
| Colombians | 55.7 /100 | #170 | Average 13.4% |
| Whites/Caucasians | 54.6 /100 | #171 | Average 13.4% |
| Mongolians | 53.6 /100 | #172 | Average 13.4% |
| Immigrants | Afghanistan | 50.8 /100 | #173 | Average 13.4% |
| Immigrants | Iraq | 50.0 /100 | #174 | Average 13.4% |
| Celtics | 49.9 /100 | #175 | Average 13.4% |
| Immigrants | Spain | 49.9 /100 | #176 | Average 13.4% |
| Immigrants | Morocco | 49.4 /100 | #177 | Average 13.4% |