Immigrants from Kenya vs Korean Child Poverty Among Girls Under 16
COMPARE
Immigrants from Kenya
Korean
Child Poverty Among Girls Under 16
Child Poverty Among Girls Under 16 Comparison
Immigrants from Kenya
Koreans
17.2%
CHILD POVERTY AMONG GIRLS UNDER 16
17.8/ 100
METRIC RATING
201st/ 347
METRIC RANK
14.1%
CHILD POVERTY AMONG GIRLS UNDER 16
99.4/ 100
METRIC RATING
43rd/ 347
METRIC RANK
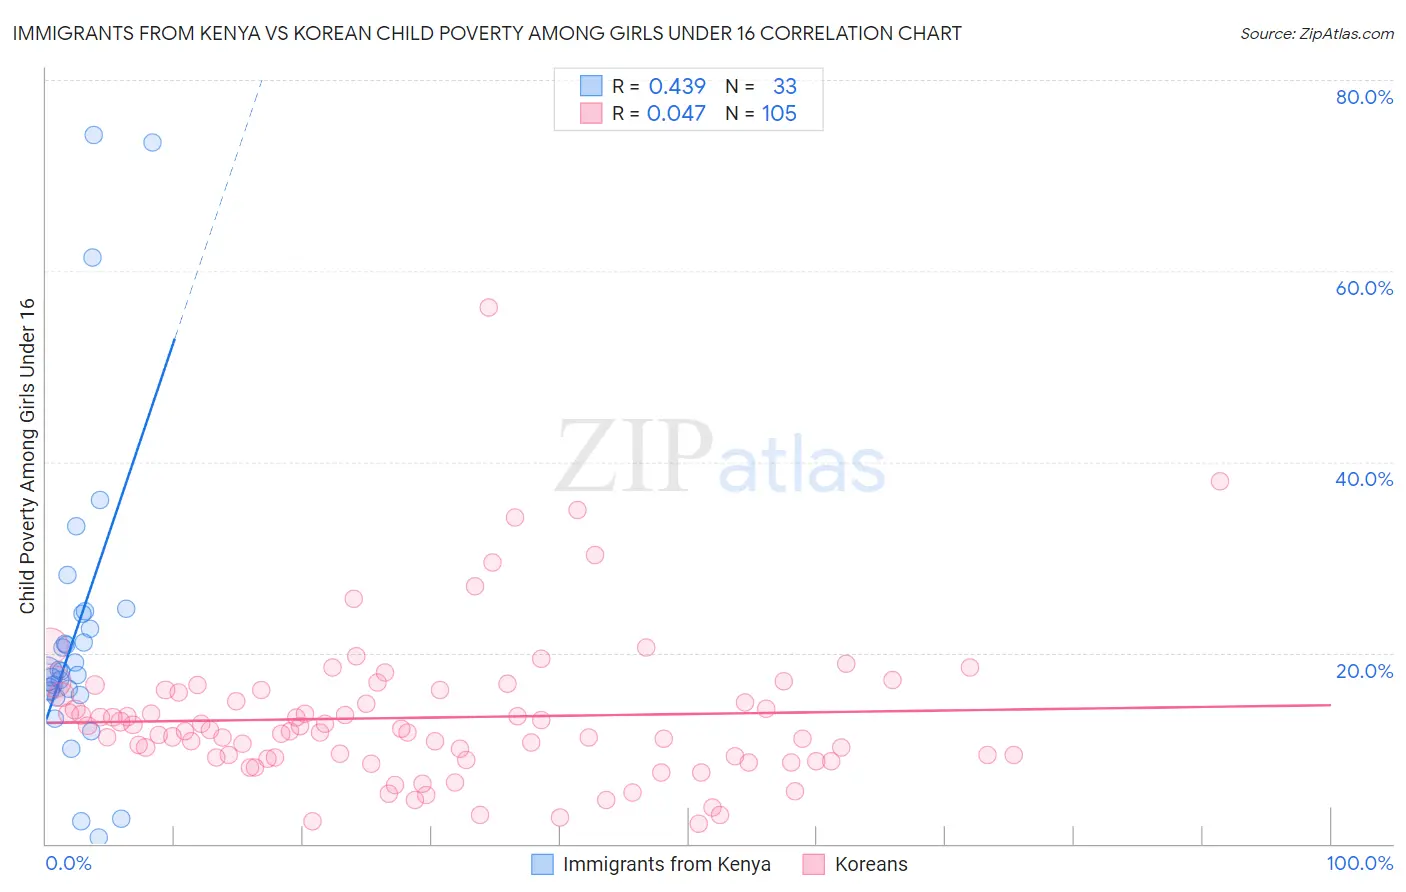
Immigrants from Kenya vs Korean Child Poverty Among Girls Under 16 Correlation Chart
The statistical analysis conducted on geographies consisting of 216,258,173 people shows a moderate positive correlation between the proportion of Immigrants from Kenya and poverty level among girls under the age of 16 in the United States with a correlation coefficient (R) of 0.439 and weighted average of 17.2%. Similarly, the statistical analysis conducted on geographies consisting of 497,455,609 people shows no correlation between the proportion of Koreans and poverty level among girls under the age of 16 in the United States with a correlation coefficient (R) of 0.047 and weighted average of 14.1%, a difference of 22.4%.
Child Poverty Among Girls Under 16 Correlation Summary
| Measurement | Immigrants from Kenya | Korean |
| Minimum | 0.70% | 2.1% |
| Maximum | 74.2% | 56.1% |
| Range | 73.5% | 54.0% |
| Mean | 22.6% | 13.2% |
| Median | 18.0% | 11.8% |
| Interquartile 25% (IQ1) | 15.8% | 9.0% |
| Interquartile 75% (IQ3) | 24.2% | 16.0% |
| Interquartile Range (IQR) | 8.4% | 7.0% |
| Standard Deviation (Sample) | 16.9% | 7.8% |
| Standard Deviation (Population) | 16.7% | 7.8% |
Similar Demographics by Child Poverty Among Girls Under 16
Demographics Similar to Immigrants from Kenya by Child Poverty Among Girls Under 16
In terms of child poverty among girls under 16, the demographic groups most similar to Immigrants from Kenya are Immigrants from Sierra Leone (17.2%, a difference of 0.050%), Ugandan (17.2%, a difference of 0.060%), Immigrants from Uzbekistan (17.1%, a difference of 0.64%), Immigrants from Afghanistan (17.1%, a difference of 0.79%), and Immigrants from Lebanon (17.1%, a difference of 0.82%).
| Demographics | Rating | Rank | Child Poverty Among Girls Under 16 |
| Spanish | 28.6 /100 | #194 | Fair 16.9% |
| Immigrants | Costa Rica | 25.6 /100 | #195 | Fair 17.0% |
| Celtics | 25.2 /100 | #196 | Fair 17.0% |
| Spaniards | 24.9 /100 | #197 | Fair 17.0% |
| Immigrants | Lebanon | 22.6 /100 | #198 | Fair 17.1% |
| Immigrants | Afghanistan | 22.4 /100 | #199 | Fair 17.1% |
| Immigrants | Uzbekistan | 21.5 /100 | #200 | Fair 17.1% |
| Immigrants | Kenya | 17.8 /100 | #201 | Poor 17.2% |
| Immigrants | Sierra Leone | 17.6 /100 | #202 | Poor 17.2% |
| Ugandans | 17.5 /100 | #203 | Poor 17.2% |
| Iraqis | 13.0 /100 | #204 | Poor 17.4% |
| Immigrants | Cameroon | 12.6 /100 | #205 | Poor 17.4% |
| Delaware | 11.5 /100 | #206 | Poor 17.4% |
| Hmong | 10.6 /100 | #207 | Poor 17.5% |
| Sierra Leoneans | 8.9 /100 | #208 | Tragic 17.6% |
Demographics Similar to Koreans by Child Poverty Among Girls Under 16
In terms of child poverty among girls under 16, the demographic groups most similar to Koreans are Immigrants from Scotland (14.0%, a difference of 0.14%), Immigrants from Asia (14.1%, a difference of 0.14%), Immigrants from Sri Lanka (14.0%, a difference of 0.31%), Immigrants from Bolivia (14.0%, a difference of 0.31%), and Immigrants from Australia (14.0%, a difference of 0.40%).
| Demographics | Rating | Rank | Child Poverty Among Girls Under 16 |
| Russians | 99.6 /100 | #36 | Exceptional 13.9% |
| Lithuanians | 99.6 /100 | #37 | Exceptional 13.9% |
| Immigrants | Moldova | 99.6 /100 | #38 | Exceptional 13.9% |
| Immigrants | Australia | 99.5 /100 | #39 | Exceptional 14.0% |
| Immigrants | Sri Lanka | 99.5 /100 | #40 | Exceptional 14.0% |
| Immigrants | Bolivia | 99.5 /100 | #41 | Exceptional 14.0% |
| Immigrants | Scotland | 99.4 /100 | #42 | Exceptional 14.0% |
| Koreans | 99.4 /100 | #43 | Exceptional 14.1% |
| Immigrants | Asia | 99.4 /100 | #44 | Exceptional 14.1% |
| Immigrants | Greece | 99.3 /100 | #45 | Exceptional 14.1% |
| Croatians | 99.3 /100 | #46 | Exceptional 14.1% |
| Immigrants | Czechoslovakia | 99.3 /100 | #47 | Exceptional 14.2% |
| Czechs | 99.3 /100 | #48 | Exceptional 14.2% |
| Greeks | 99.2 /100 | #49 | Exceptional 14.2% |
| Immigrants | Israel | 99.2 /100 | #50 | Exceptional 14.2% |