Immigrants from Kenya vs Immigrants from Central America Disability Age Over 75
COMPARE
Immigrants from Kenya
Immigrants from Central America
Disability Age Over 75
Disability Age Over 75 Comparison
Immigrants from Kenya
Immigrants from Central America
47.6%
DISABILITY AGE OVER 75
30.8/ 100
METRIC RATING
189th/ 347
METRIC RANK
50.5%
DISABILITY AGE OVER 75
0.0/ 100
METRIC RATING
306th/ 347
METRIC RANK
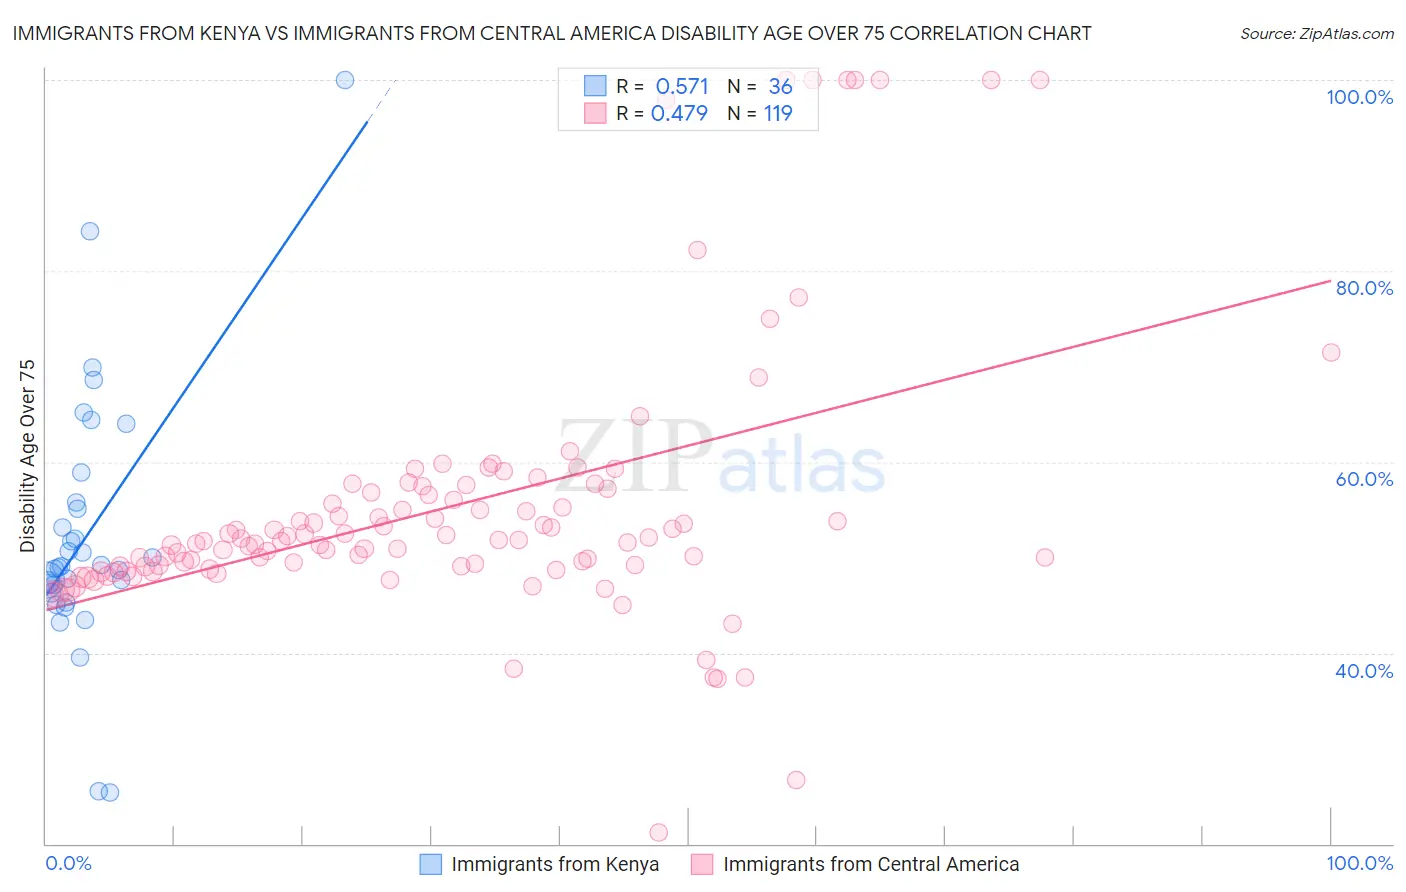
Immigrants from Kenya vs Immigrants from Central America Disability Age Over 75 Correlation Chart
The statistical analysis conducted on geographies consisting of 217,778,670 people shows a substantial positive correlation between the proportion of Immigrants from Kenya and percentage of population with a disability over the age of 75 in the United States with a correlation coefficient (R) of 0.571 and weighted average of 47.6%. Similarly, the statistical analysis conducted on geographies consisting of 534,859,975 people shows a moderate positive correlation between the proportion of Immigrants from Central America and percentage of population with a disability over the age of 75 in the United States with a correlation coefficient (R) of 0.479 and weighted average of 50.5%, a difference of 6.3%.
Disability Age Over 75 Correlation Summary
| Measurement | Immigrants from Kenya | Immigrants from Central America |
| Minimum | 25.4% | 21.2% |
| Maximum | 100.0% | 100.0% |
| Range | 74.6% | 78.8% |
| Mean | 52.3% | 55.2% |
| Median | 49.0% | 51.7% |
| Interquartile 25% (IQ1) | 46.7% | 49.0% |
| Interquartile 75% (IQ3) | 55.5% | 56.7% |
| Interquartile Range (IQR) | 8.8% | 7.7% |
| Standard Deviation (Sample) | 13.7% | 14.3% |
| Standard Deviation (Population) | 13.5% | 14.2% |
Similar Demographics by Disability Age Over 75
Demographics Similar to Immigrants from Kenya by Disability Age Over 75
In terms of disability age over 75, the demographic groups most similar to Immigrants from Kenya are Basque (47.6%, a difference of 0.0%), Immigrants from Sudan (47.5%, a difference of 0.020%), Sudanese (47.5%, a difference of 0.030%), Somali (47.6%, a difference of 0.040%), and Portuguese (47.6%, a difference of 0.040%).
| Demographics | Rating | Rank | Disability Age Over 75 |
| Immigrants | Moldova | 39.9 /100 | #182 | Fair 47.4% |
| Delaware | 39.1 /100 | #183 | Fair 47.5% |
| Immigrants | Nigeria | 34.0 /100 | #184 | Fair 47.5% |
| Ghanaians | 33.0 /100 | #185 | Fair 47.5% |
| Sudanese | 32.0 /100 | #186 | Fair 47.5% |
| Immigrants | Sudan | 31.8 /100 | #187 | Fair 47.5% |
| Basques | 30.9 /100 | #188 | Fair 47.6% |
| Immigrants | Kenya | 30.8 /100 | #189 | Fair 47.6% |
| Somalis | 29.5 /100 | #190 | Fair 47.6% |
| Portuguese | 29.3 /100 | #191 | Fair 47.6% |
| Immigrants | Jamaica | 28.3 /100 | #192 | Fair 47.6% |
| Ottawa | 28.1 /100 | #193 | Fair 47.6% |
| Immigrants | Lebanon | 26.5 /100 | #194 | Fair 47.6% |
| Immigrants | Trinidad and Tobago | 25.3 /100 | #195 | Fair 47.6% |
| Immigrants | Portugal | 23.8 /100 | #196 | Fair 47.6% |
Demographics Similar to Immigrants from Central America by Disability Age Over 75
In terms of disability age over 75, the demographic groups most similar to Immigrants from Central America are Immigrants from Fiji (50.6%, a difference of 0.060%), Hispanic or Latino (50.6%, a difference of 0.080%), Aleut (50.6%, a difference of 0.080%), Central American Indian (50.5%, a difference of 0.090%), and Tlingit-Haida (50.6%, a difference of 0.12%).
| Demographics | Rating | Rank | Disability Age Over 75 |
| Immigrants | Micronesia | 0.0 /100 | #299 | Tragic 50.1% |
| Cape Verdeans | 0.0 /100 | #300 | Tragic 50.1% |
| Dominicans | 0.0 /100 | #301 | Tragic 50.2% |
| Cherokee | 0.0 /100 | #302 | Tragic 50.2% |
| Japanese | 0.0 /100 | #303 | Tragic 50.2% |
| Immigrants | Dominican Republic | 0.0 /100 | #304 | Tragic 50.3% |
| Central American Indians | 0.0 /100 | #305 | Tragic 50.5% |
| Immigrants | Central America | 0.0 /100 | #306 | Tragic 50.5% |
| Immigrants | Fiji | 0.0 /100 | #307 | Tragic 50.6% |
| Hispanics or Latinos | 0.0 /100 | #308 | Tragic 50.6% |
| Aleuts | 0.0 /100 | #309 | Tragic 50.6% |
| Tlingit-Haida | 0.0 /100 | #310 | Tragic 50.6% |
| Cajuns | 0.0 /100 | #311 | Tragic 50.7% |
| Cheyenne | 0.0 /100 | #312 | Tragic 50.9% |
| Immigrants | Azores | 0.0 /100 | #313 | Tragic 50.9% |