Immigrants from Kazakhstan vs Australian 8th Grade
COMPARE
Immigrants from Kazakhstan
Australian
8th Grade
8th Grade Comparison
Immigrants from Kazakhstan
Australians
95.9%
8TH GRADE
68.4/ 100
METRIC RATING
159th/ 347
METRIC RANK
96.7%
8TH GRADE
99.8/ 100
METRIC RATING
56th/ 347
METRIC RANK
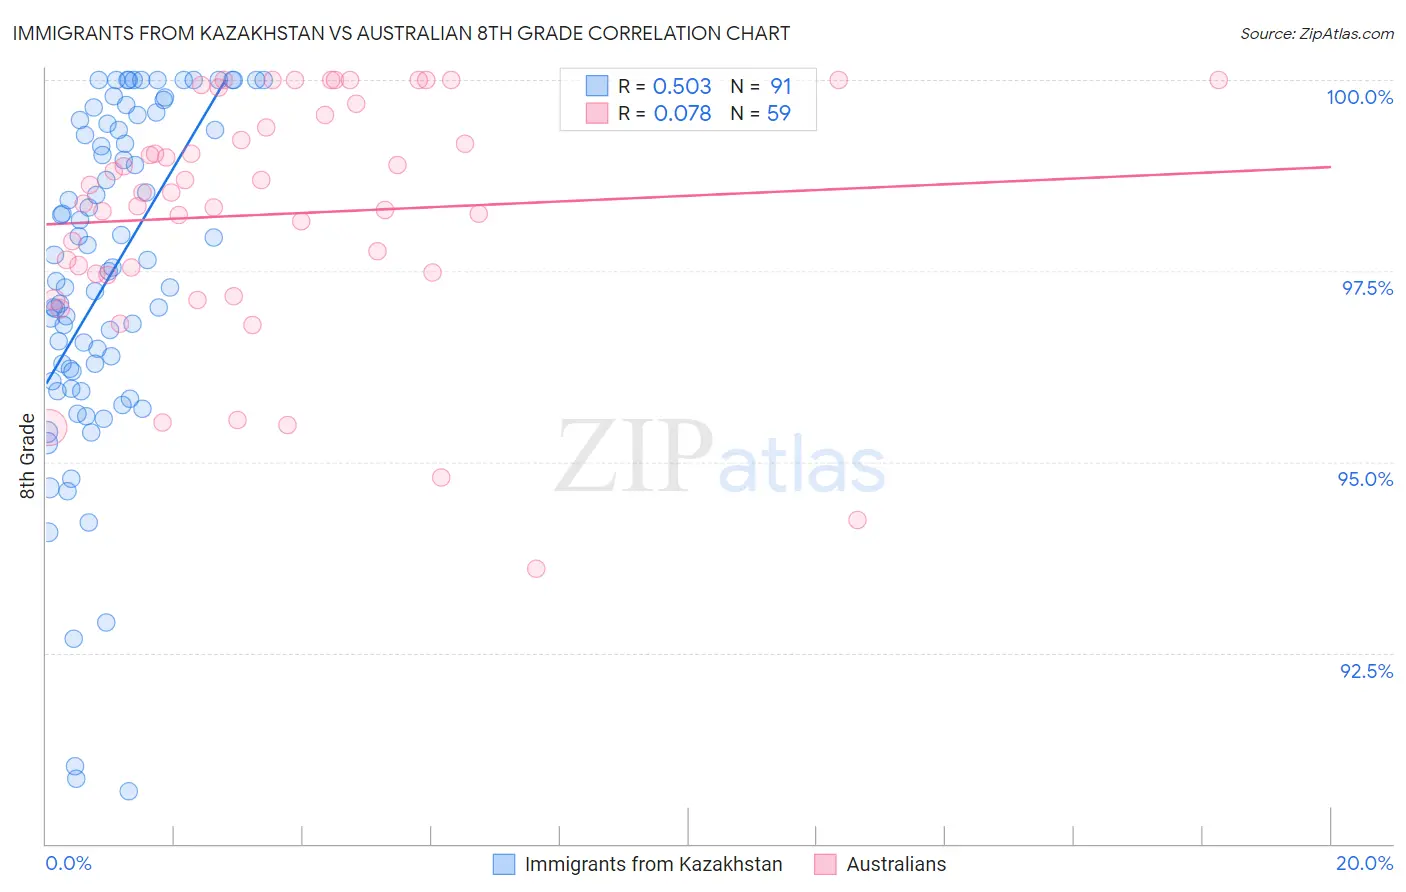
Immigrants from Kazakhstan vs Australian 8th Grade Correlation Chart
The statistical analysis conducted on geographies consisting of 124,380,834 people shows a substantial positive correlation between the proportion of Immigrants from Kazakhstan and percentage of population with at least 8th grade education in the United States with a correlation coefficient (R) of 0.503 and weighted average of 95.9%. Similarly, the statistical analysis conducted on geographies consisting of 224,153,693 people shows a slight positive correlation between the proportion of Australians and percentage of population with at least 8th grade education in the United States with a correlation coefficient (R) of 0.078 and weighted average of 96.7%, a difference of 0.92%.
8th Grade Correlation Summary
| Measurement | Immigrants from Kazakhstan | Australian |
| Minimum | 90.7% | 93.6% |
| Maximum | 100.0% | 100.0% |
| Range | 9.3% | 6.4% |
| Mean | 97.4% | 98.2% |
| Median | 97.5% | 98.5% |
| Interquartile 25% (IQ1) | 96.1% | 97.5% |
| Interquartile 75% (IQ3) | 99.4% | 99.5% |
| Interquartile Range (IQR) | 3.4% | 2.1% |
| Standard Deviation (Sample) | 2.2% | 1.6% |
| Standard Deviation (Population) | 2.2% | 1.6% |
Similar Demographics by 8th Grade
Demographics Similar to Immigrants from Kazakhstan by 8th Grade
In terms of 8th grade, the demographic groups most similar to Immigrants from Kazakhstan are Arab (95.9%, a difference of 0.010%), Seminole (95.8%, a difference of 0.010%), Bermudan (95.8%, a difference of 0.010%), Immigrants from Kenya (95.8%, a difference of 0.010%), and Immigrants from Taiwan (95.9%, a difference of 0.020%).
| Demographics | Rating | Rank | 8th Grade |
| French American Indians | 80.6 /100 | #152 | Excellent 96.0% |
| Immigrants | Jordan | 79.5 /100 | #153 | Good 95.9% |
| Hopi | 79.4 /100 | #154 | Good 95.9% |
| Kenyans | 74.5 /100 | #155 | Good 95.9% |
| Ugandans | 74.1 /100 | #156 | Good 95.9% |
| Immigrants | Taiwan | 70.5 /100 | #157 | Good 95.9% |
| Arabs | 69.4 /100 | #158 | Good 95.9% |
| Immigrants | Kazakhstan | 68.4 /100 | #159 | Good 95.9% |
| Seminole | 67.7 /100 | #160 | Good 95.8% |
| Bermudans | 67.5 /100 | #161 | Good 95.8% |
| Immigrants | Kenya | 67.2 /100 | #162 | Good 95.8% |
| Immigrants | Sri Lanka | 64.1 /100 | #163 | Good 95.8% |
| Immigrants | Italy | 63.5 /100 | #164 | Good 95.8% |
| Alsatians | 61.4 /100 | #165 | Good 95.8% |
| Immigrants | Poland | 61.1 /100 | #166 | Good 95.8% |
Demographics Similar to Australians by 8th Grade
In terms of 8th grade, the demographic groups most similar to Australians are Serbian (96.7%, a difference of 0.0%), Russian (96.7%, a difference of 0.0%), Macedonian (96.7%, a difference of 0.0%), Austrian (96.7%, a difference of 0.010%), and Greek (96.8%, a difference of 0.030%).
| Demographics | Rating | Rank | 8th Grade |
| Estonians | 99.9 /100 | #49 | Exceptional 96.8% |
| Immigrants | Scotland | 99.9 /100 | #50 | Exceptional 96.8% |
| Celtics | 99.9 /100 | #51 | Exceptional 96.8% |
| Greeks | 99.9 /100 | #52 | Exceptional 96.8% |
| Austrians | 99.9 /100 | #53 | Exceptional 96.7% |
| Serbians | 99.8 /100 | #54 | Exceptional 96.7% |
| Russians | 99.8 /100 | #55 | Exceptional 96.7% |
| Australians | 99.8 /100 | #56 | Exceptional 96.7% |
| Macedonians | 99.8 /100 | #57 | Exceptional 96.7% |
| Immigrants | Canada | 99.8 /100 | #58 | Exceptional 96.7% |
| Immigrants | North America | 99.8 /100 | #59 | Exceptional 96.7% |
| Immigrants | Northern Europe | 99.8 /100 | #60 | Exceptional 96.7% |
| Immigrants | Austria | 99.8 /100 | #61 | Exceptional 96.7% |
| Whites/Caucasians | 99.8 /100 | #62 | Exceptional 96.7% |
| Ukrainians | 99.7 /100 | #63 | Exceptional 96.7% |