Immigrants from Jordan vs Immigrants from Dominican Republic Family Poverty
COMPARE
Immigrants from Jordan
Immigrants from Dominican Republic
Family Poverty
Family Poverty Comparison
Immigrants from Jordan
Immigrants from Dominican Republic
8.5%
FAMILY POVERTY
83.0/ 100
METRIC RATING
147th/ 347
METRIC RANK
14.4%
FAMILY POVERTY
0.0/ 100
METRIC RATING
333rd/ 347
METRIC RANK
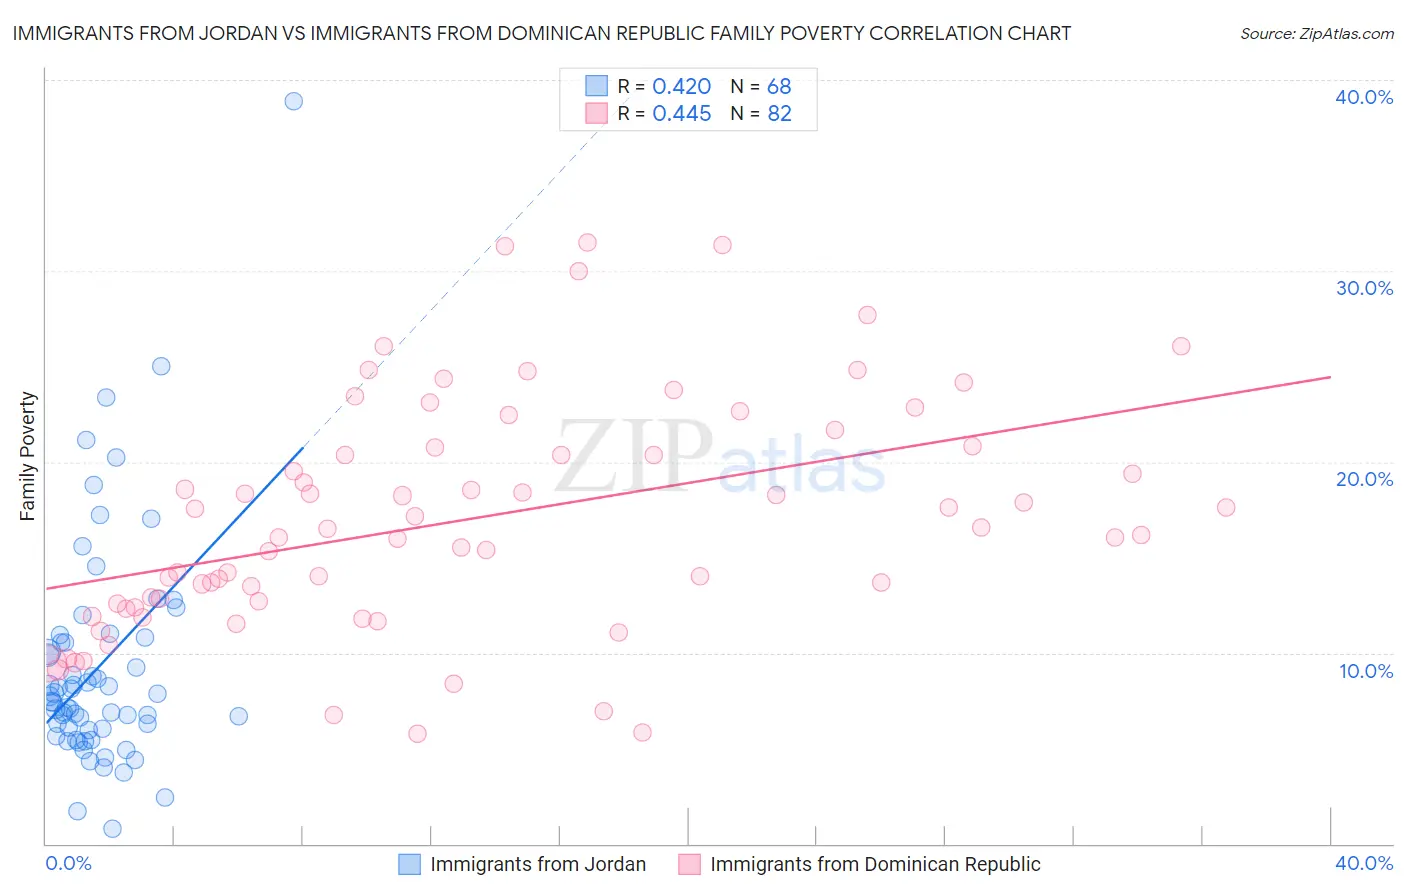
Immigrants from Jordan vs Immigrants from Dominican Republic Family Poverty Correlation Chart
The statistical analysis conducted on geographies consisting of 181,199,618 people shows a moderate positive correlation between the proportion of Immigrants from Jordan and poverty level among families in the United States with a correlation coefficient (R) of 0.420 and weighted average of 8.5%. Similarly, the statistical analysis conducted on geographies consisting of 274,499,505 people shows a moderate positive correlation between the proportion of Immigrants from Dominican Republic and poverty level among families in the United States with a correlation coefficient (R) of 0.445 and weighted average of 14.4%, a difference of 69.1%.
Family Poverty Correlation Summary
| Measurement | Immigrants from Jordan | Immigrants from Dominican Republic |
| Minimum | 0.79% | 5.8% |
| Maximum | 38.9% | 31.5% |
| Range | 38.1% | 25.8% |
| Mean | 9.3% | 17.0% |
| Median | 7.6% | 16.3% |
| Interquartile 25% (IQ1) | 6.0% | 12.5% |
| Interquartile 75% (IQ3) | 10.7% | 20.7% |
| Interquartile Range (IQR) | 4.7% | 8.2% |
| Standard Deviation (Sample) | 6.1% | 6.1% |
| Standard Deviation (Population) | 6.0% | 6.0% |
Similar Demographics by Family Poverty
Demographics Similar to Immigrants from Jordan by Family Poverty
In terms of family poverty, the demographic groups most similar to Immigrants from Jordan are Immigrants from Belarus (8.5%, a difference of 0.030%), Immigrants from South Eastern Asia (8.5%, a difference of 0.050%), Albanian (8.5%, a difference of 0.060%), Immigrants from Germany (8.5%, a difference of 0.080%), and Yugoslavian (8.5%, a difference of 0.12%).
| Demographics | Rating | Rank | Family Poverty |
| Immigrants | Kazakhstan | 84.1 /100 | #140 | Excellent 8.5% |
| Immigrants | Ukraine | 83.9 /100 | #141 | Excellent 8.5% |
| Yugoslavians | 83.5 /100 | #142 | Excellent 8.5% |
| Immigrants | Germany | 83.3 /100 | #143 | Excellent 8.5% |
| Albanians | 83.3 /100 | #144 | Excellent 8.5% |
| Immigrants | South Eastern Asia | 83.2 /100 | #145 | Excellent 8.5% |
| Immigrants | Belarus | 83.2 /100 | #146 | Excellent 8.5% |
| Immigrants | Jordan | 83.0 /100 | #147 | Excellent 8.5% |
| Scotch-Irish | 82.2 /100 | #148 | Excellent 8.6% |
| Mongolians | 80.4 /100 | #149 | Excellent 8.6% |
| Syrians | 80.3 /100 | #150 | Excellent 8.6% |
| Brazilians | 80.1 /100 | #151 | Excellent 8.6% |
| Samoans | 79.8 /100 | #152 | Good 8.6% |
| Immigrants | Spain | 79.1 /100 | #153 | Good 8.6% |
| Immigrants | Vietnam | 75.4 /100 | #154 | Good 8.7% |
Demographics Similar to Immigrants from Dominican Republic by Family Poverty
In terms of family poverty, the demographic groups most similar to Immigrants from Dominican Republic are Dominican (14.3%, a difference of 0.63%), Cheyenne (14.3%, a difference of 1.1%), Native/Alaskan (14.3%, a difference of 1.2%), Houma (14.6%, a difference of 1.3%), and Apache (14.7%, a difference of 2.1%).
| Demographics | Rating | Rank | Family Poverty |
| Colville | 0.0 /100 | #326 | Tragic 13.0% |
| Yakama | 0.0 /100 | #327 | Tragic 13.1% |
| Central American Indians | 0.0 /100 | #328 | Tragic 13.3% |
| Blacks/African Americans | 0.0 /100 | #329 | Tragic 13.3% |
| Natives/Alaskans | 0.0 /100 | #330 | Tragic 14.3% |
| Cheyenne | 0.0 /100 | #331 | Tragic 14.3% |
| Dominicans | 0.0 /100 | #332 | Tragic 14.3% |
| Immigrants | Dominican Republic | 0.0 /100 | #333 | Tragic 14.4% |
| Houma | 0.0 /100 | #334 | Tragic 14.6% |
| Apache | 0.0 /100 | #335 | Tragic 14.7% |
| Sioux | 0.0 /100 | #336 | Tragic 15.9% |
| Hopi | 0.0 /100 | #337 | Tragic 15.9% |
| Crow | 0.0 /100 | #338 | Tragic 16.1% |
| Yuman | 0.0 /100 | #339 | Tragic 16.6% |
| Pueblo | 0.0 /100 | #340 | Tragic 17.0% |