Immigrants from Jordan vs Guatemalan Family Poverty
COMPARE
Immigrants from Jordan
Guatemalan
Family Poverty
Family Poverty Comparison
Immigrants from Jordan
Guatemalans
8.5%
FAMILY POVERTY
83.0/ 100
METRIC RATING
147th/ 347
METRIC RANK
11.7%
FAMILY POVERTY
0.0/ 100
METRIC RATING
302nd/ 347
METRIC RANK
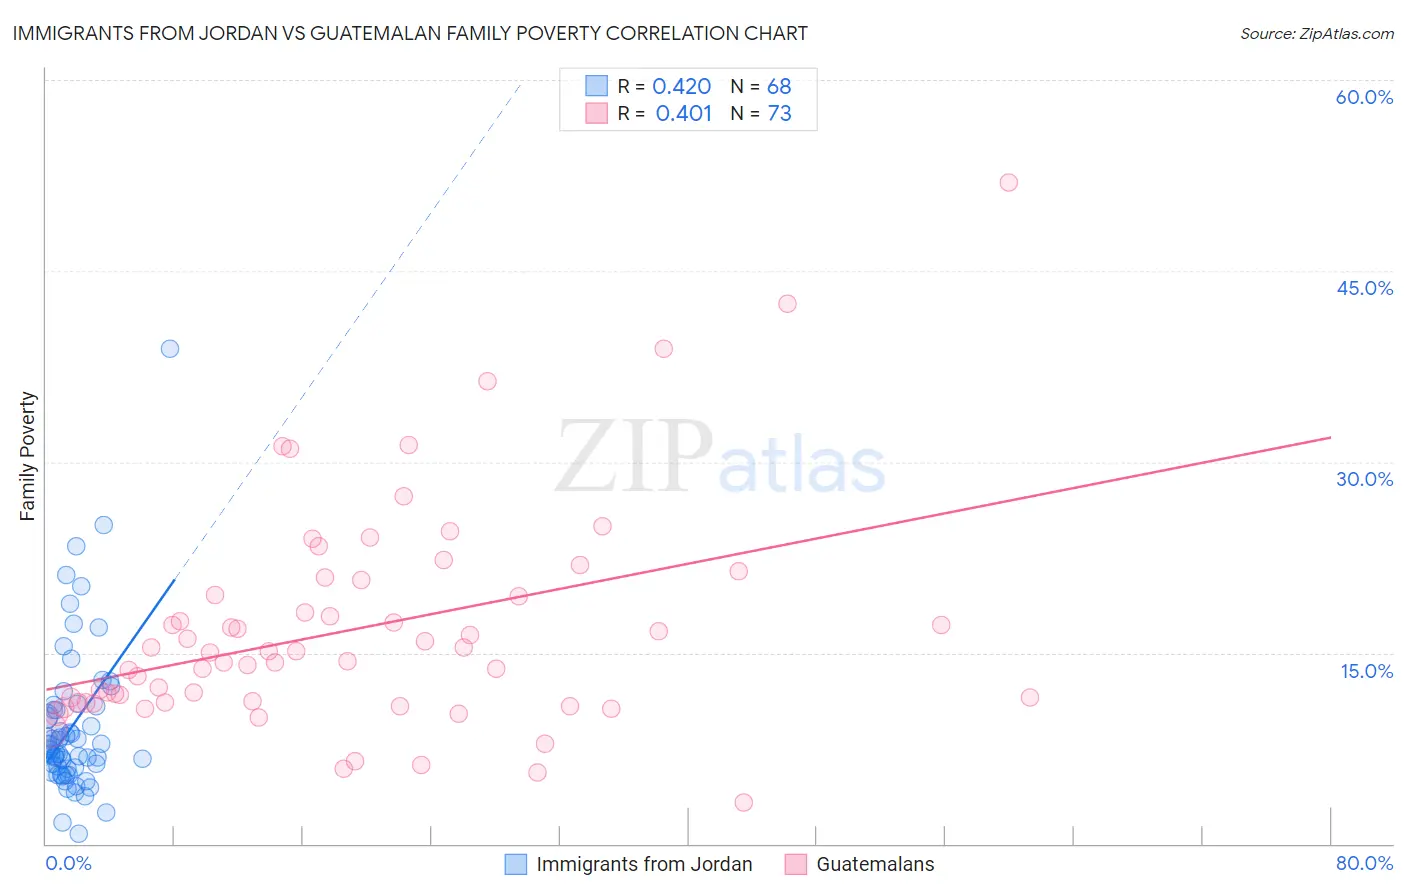
Immigrants from Jordan vs Guatemalan Family Poverty Correlation Chart
The statistical analysis conducted on geographies consisting of 181,199,618 people shows a moderate positive correlation between the proportion of Immigrants from Jordan and poverty level among families in the United States with a correlation coefficient (R) of 0.420 and weighted average of 8.5%. Similarly, the statistical analysis conducted on geographies consisting of 408,686,067 people shows a moderate positive correlation between the proportion of Guatemalans and poverty level among families in the United States with a correlation coefficient (R) of 0.401 and weighted average of 11.7%, a difference of 37.2%.
Family Poverty Correlation Summary
| Measurement | Immigrants from Jordan | Guatemalan |
| Minimum | 0.79% | 3.3% |
| Maximum | 38.9% | 51.9% |
| Range | 38.1% | 48.7% |
| Mean | 9.3% | 16.8% |
| Median | 7.6% | 15.0% |
| Interquartile 25% (IQ1) | 6.0% | 11.1% |
| Interquartile 75% (IQ3) | 10.7% | 20.1% |
| Interquartile Range (IQR) | 4.7% | 9.0% |
| Standard Deviation (Sample) | 6.1% | 8.7% |
| Standard Deviation (Population) | 6.0% | 8.6% |
Similar Demographics by Family Poverty
Demographics Similar to Immigrants from Jordan by Family Poverty
In terms of family poverty, the demographic groups most similar to Immigrants from Jordan are Immigrants from Belarus (8.5%, a difference of 0.030%), Immigrants from South Eastern Asia (8.5%, a difference of 0.050%), Albanian (8.5%, a difference of 0.060%), Immigrants from Germany (8.5%, a difference of 0.080%), and Yugoslavian (8.5%, a difference of 0.12%).
| Demographics | Rating | Rank | Family Poverty |
| Immigrants | Kazakhstan | 84.1 /100 | #140 | Excellent 8.5% |
| Immigrants | Ukraine | 83.9 /100 | #141 | Excellent 8.5% |
| Yugoslavians | 83.5 /100 | #142 | Excellent 8.5% |
| Immigrants | Germany | 83.3 /100 | #143 | Excellent 8.5% |
| Albanians | 83.3 /100 | #144 | Excellent 8.5% |
| Immigrants | South Eastern Asia | 83.2 /100 | #145 | Excellent 8.5% |
| Immigrants | Belarus | 83.2 /100 | #146 | Excellent 8.5% |
| Immigrants | Jordan | 83.0 /100 | #147 | Excellent 8.5% |
| Scotch-Irish | 82.2 /100 | #148 | Excellent 8.6% |
| Mongolians | 80.4 /100 | #149 | Excellent 8.6% |
| Syrians | 80.3 /100 | #150 | Excellent 8.6% |
| Brazilians | 80.1 /100 | #151 | Excellent 8.6% |
| Samoans | 79.8 /100 | #152 | Good 8.6% |
| Immigrants | Spain | 79.1 /100 | #153 | Good 8.6% |
| Immigrants | Vietnam | 75.4 /100 | #154 | Good 8.7% |
Demographics Similar to Guatemalans by Family Poverty
In terms of family poverty, the demographic groups most similar to Guatemalans are Bahamian (11.7%, a difference of 0.040%), Immigrants from Bangladesh (11.7%, a difference of 0.29%), Dutch West Indian (11.7%, a difference of 0.31%), Immigrants from Senegal (11.7%, a difference of 0.41%), and African (11.8%, a difference of 0.50%).
| Demographics | Rating | Rank | Family Poverty |
| Immigrants | Haiti | 0.0 /100 | #295 | Tragic 11.6% |
| Choctaw | 0.0 /100 | #296 | Tragic 11.6% |
| Creek | 0.0 /100 | #297 | Tragic 11.7% |
| Immigrants | Senegal | 0.0 /100 | #298 | Tragic 11.7% |
| Dutch West Indians | 0.0 /100 | #299 | Tragic 11.7% |
| Immigrants | Bangladesh | 0.0 /100 | #300 | Tragic 11.7% |
| Bahamians | 0.0 /100 | #301 | Tragic 11.7% |
| Guatemalans | 0.0 /100 | #302 | Tragic 11.7% |
| Africans | 0.0 /100 | #303 | Tragic 11.8% |
| Immigrants | Latin America | 0.0 /100 | #304 | Tragic 11.8% |
| Mexicans | 0.0 /100 | #305 | Tragic 11.8% |
| Cajuns | 0.0 /100 | #306 | Tragic 11.9% |
| Immigrants | Congo | 0.0 /100 | #307 | Tragic 11.9% |
| Seminole | 0.0 /100 | #308 | Tragic 11.9% |
| Hispanics or Latinos | 0.0 /100 | #309 | Tragic 12.0% |