Immigrants from Jordan vs Zimbabwean Family Poverty
COMPARE
Immigrants from Jordan
Zimbabwean
Family Poverty
Family Poverty Comparison
Immigrants from Jordan
Zimbabweans
8.5%
FAMILY POVERTY
83.0/ 100
METRIC RATING
147th/ 347
METRIC RANK
7.8%
FAMILY POVERTY
98.4/ 100
METRIC RATING
63rd/ 347
METRIC RANK
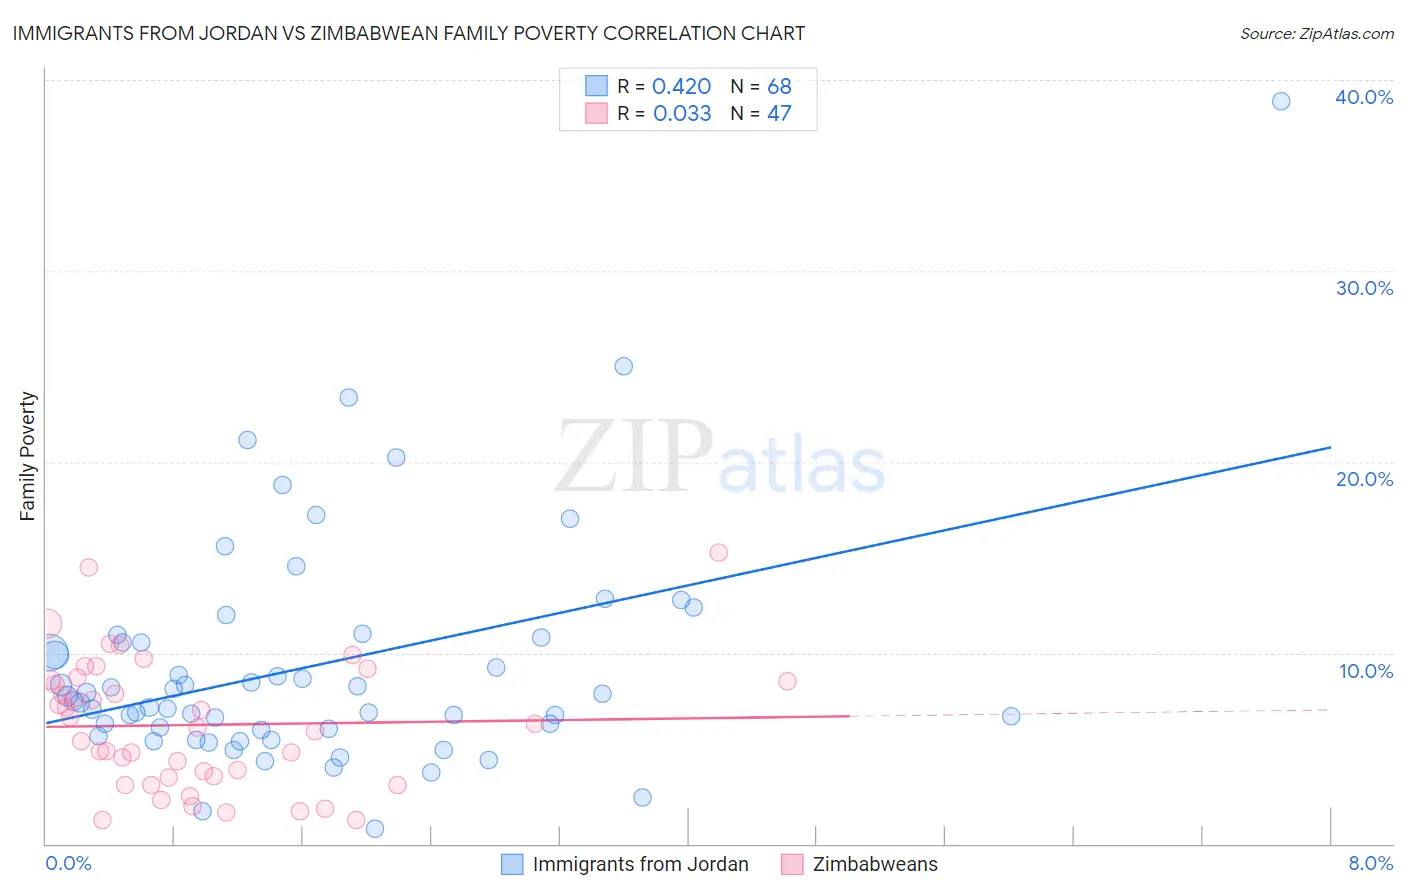
Immigrants from Jordan vs Zimbabwean Family Poverty Correlation Chart
The statistical analysis conducted on geographies consisting of 181,199,618 people shows a moderate positive correlation between the proportion of Immigrants from Jordan and poverty level among families in the United States with a correlation coefficient (R) of 0.420 and weighted average of 8.5%. Similarly, the statistical analysis conducted on geographies consisting of 69,162,841 people shows no correlation between the proportion of Zimbabweans and poverty level among families in the United States with a correlation coefficient (R) of 0.033 and weighted average of 7.8%, a difference of 9.5%.
Family Poverty Correlation Summary
| Measurement | Immigrants from Jordan | Zimbabwean |
| Minimum | 0.79% | 1.2% |
| Maximum | 38.9% | 15.3% |
| Range | 38.1% | 14.0% |
| Mean | 9.3% | 6.2% |
| Median | 7.6% | 6.1% |
| Interquartile 25% (IQ1) | 6.0% | 3.5% |
| Interquartile 75% (IQ3) | 10.7% | 8.6% |
| Interquartile Range (IQR) | 4.7% | 5.1% |
| Standard Deviation (Sample) | 6.1% | 3.4% |
| Standard Deviation (Population) | 6.0% | 3.4% |
Similar Demographics by Family Poverty
Demographics Similar to Immigrants from Jordan by Family Poverty
In terms of family poverty, the demographic groups most similar to Immigrants from Jordan are Immigrants from Belarus (8.5%, a difference of 0.030%), Immigrants from South Eastern Asia (8.5%, a difference of 0.050%), Albanian (8.5%, a difference of 0.060%), Immigrants from Germany (8.5%, a difference of 0.080%), and Yugoslavian (8.5%, a difference of 0.12%).
| Demographics | Rating | Rank | Family Poverty |
| Immigrants | Kazakhstan | 84.1 /100 | #140 | Excellent 8.5% |
| Immigrants | Ukraine | 83.9 /100 | #141 | Excellent 8.5% |
| Yugoslavians | 83.5 /100 | #142 | Excellent 8.5% |
| Immigrants | Germany | 83.3 /100 | #143 | Excellent 8.5% |
| Albanians | 83.3 /100 | #144 | Excellent 8.5% |
| Immigrants | South Eastern Asia | 83.2 /100 | #145 | Excellent 8.5% |
| Immigrants | Belarus | 83.2 /100 | #146 | Excellent 8.5% |
| Immigrants | Jordan | 83.0 /100 | #147 | Excellent 8.5% |
| Scotch-Irish | 82.2 /100 | #148 | Excellent 8.6% |
| Mongolians | 80.4 /100 | #149 | Excellent 8.6% |
| Syrians | 80.3 /100 | #150 | Excellent 8.6% |
| Brazilians | 80.1 /100 | #151 | Excellent 8.6% |
| Samoans | 79.8 /100 | #152 | Good 8.6% |
| Immigrants | Spain | 79.1 /100 | #153 | Good 8.6% |
| Immigrants | Vietnam | 75.4 /100 | #154 | Good 8.7% |
Demographics Similar to Zimbabweans by Family Poverty
In terms of family poverty, the demographic groups most similar to Zimbabweans are Korean (7.8%, a difference of 0.15%), Immigrants from Bulgaria (7.8%, a difference of 0.16%), Dutch (7.8%, a difference of 0.22%), Northern European (7.8%, a difference of 0.23%), and Australian (7.8%, a difference of 0.27%).
| Demographics | Rating | Rank | Family Poverty |
| Immigrants | Serbia | 98.7 /100 | #56 | Exceptional 7.7% |
| Asians | 98.7 /100 | #57 | Exceptional 7.7% |
| Finns | 98.7 /100 | #58 | Exceptional 7.7% |
| Europeans | 98.7 /100 | #59 | Exceptional 7.7% |
| Immigrants | Greece | 98.7 /100 | #60 | Exceptional 7.7% |
| Immigrants | Netherlands | 98.6 /100 | #61 | Exceptional 7.7% |
| Macedonians | 98.6 /100 | #62 | Exceptional 7.8% |
| Zimbabweans | 98.4 /100 | #63 | Exceptional 7.8% |
| Koreans | 98.3 /100 | #64 | Exceptional 7.8% |
| Immigrants | Bulgaria | 98.3 /100 | #65 | Exceptional 7.8% |
| Dutch | 98.3 /100 | #66 | Exceptional 7.8% |
| Northern Europeans | 98.3 /100 | #67 | Exceptional 7.8% |
| Australians | 98.2 /100 | #68 | Exceptional 7.8% |
| Immigrants | Belgium | 98.2 /100 | #69 | Exceptional 7.8% |
| Immigrants | Canada | 98.2 /100 | #70 | Exceptional 7.8% |