Immigrants from Japan vs Lebanese Unemployment Among Ages 16 to 19 years
COMPARE
Immigrants from Japan
Lebanese
Unemployment Among Ages 16 to 19 years
Unemployment Among Ages 16 to 19 years Comparison
Immigrants from Japan
Lebanese
16.6%
UNEMPLOYMENT AMONG AGES 16 TO 19 YEARS
98.9/ 100
METRIC RATING
65th/ 347
METRIC RANK
16.4%
UNEMPLOYMENT AMONG AGES 16 TO 19 YEARS
99.6/ 100
METRIC RATING
51st/ 347
METRIC RANK
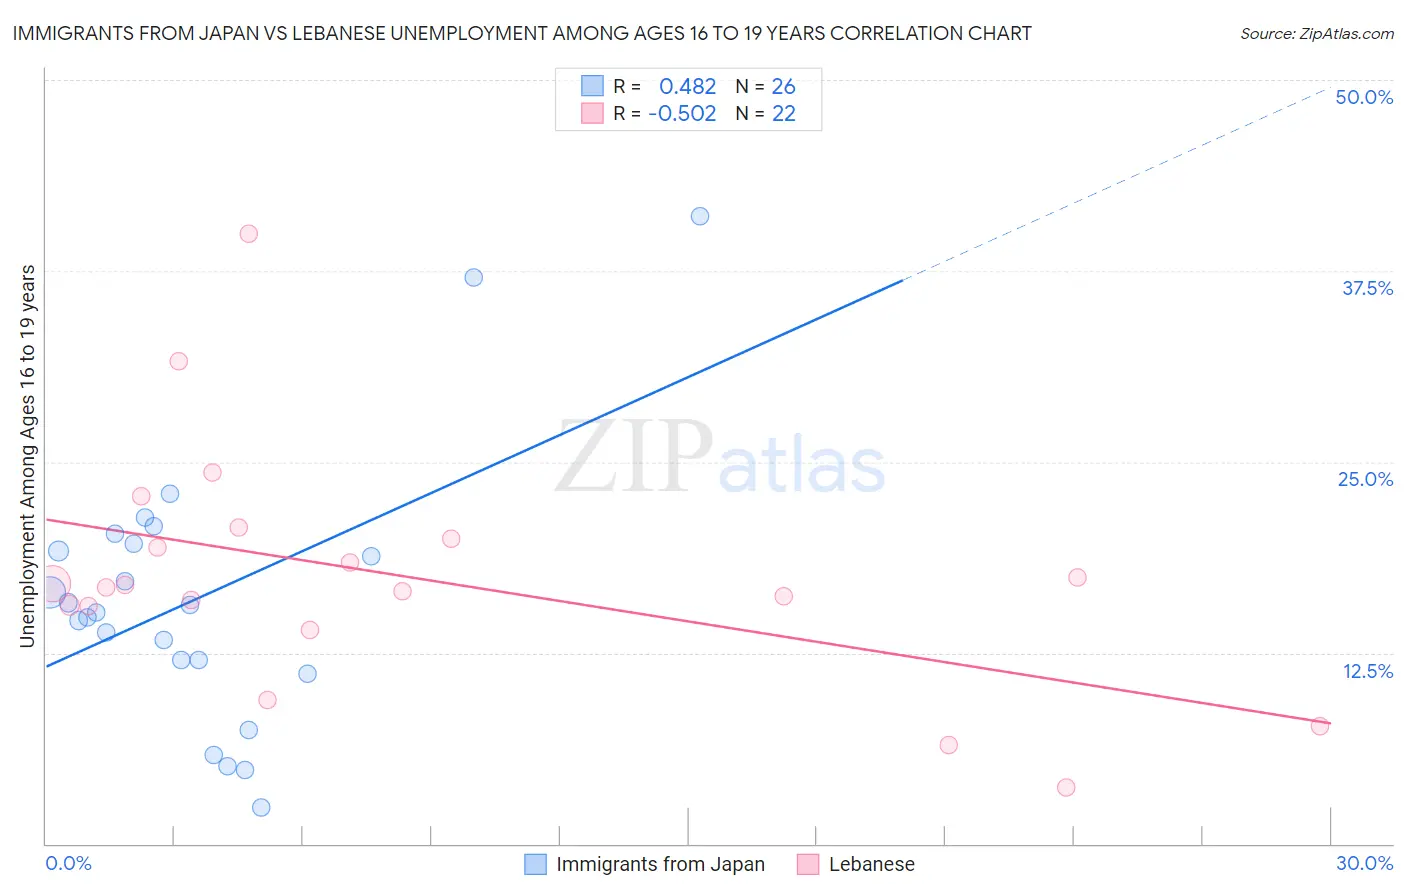
Immigrants from Japan vs Lebanese Unemployment Among Ages 16 to 19 years Correlation Chart
The statistical analysis conducted on geographies consisting of 326,097,714 people shows a moderate positive correlation between the proportion of Immigrants from Japan and unemployment rate among population between the ages 16 and 19 in the United States with a correlation coefficient (R) of 0.482 and weighted average of 16.6%. Similarly, the statistical analysis conducted on geographies consisting of 379,959,035 people shows a substantial negative correlation between the proportion of Lebanese and unemployment rate among population between the ages 16 and 19 in the United States with a correlation coefficient (R) of -0.502 and weighted average of 16.4%, a difference of 1.3%.
Unemployment Among Ages 16 to 19 years Correlation Summary
| Measurement | Immigrants from Japan | Lebanese |
| Minimum | 2.4% | 3.7% |
| Maximum | 41.1% | 39.9% |
| Range | 38.7% | 36.2% |
| Mean | 16.1% | 17.6% |
| Median | 15.4% | 16.9% |
| Interquartile 25% (IQ1) | 12.0% | 15.5% |
| Interquartile 75% (IQ3) | 19.6% | 20.0% |
| Interquartile Range (IQR) | 7.6% | 4.5% |
| Standard Deviation (Sample) | 8.7% | 7.8% |
| Standard Deviation (Population) | 8.6% | 7.7% |
Demographics Similar to Immigrants from Japan and Lebanese by Unemployment Among Ages 16 to 19 years
In terms of unemployment among ages 16 to 19 years, the demographic groups most similar to Immigrants from Japan are Okinawan (16.6%, a difference of 0.030%), Northern European (16.6%, a difference of 0.10%), Scotch-Irish (16.6%, a difference of 0.16%), Slavic (16.7%, a difference of 0.20%), and Chickasaw (16.7%, a difference of 0.20%). Similarly, the demographic groups most similar to Lebanese are Welsh (16.4%, a difference of 0.030%), Bhutanese (16.4%, a difference of 0.10%), Slovene (16.4%, a difference of 0.12%), British (16.5%, a difference of 0.17%), and Czechoslovakian (16.5%, a difference of 0.19%).
| Demographics | Rating | Rank | Unemployment Among Ages 16 to 19 years |
| Maltese | 99.7 /100 | #48 | Exceptional 16.4% |
| Iraqis | 99.7 /100 | #49 | Exceptional 16.4% |
| Bhutanese | 99.6 /100 | #50 | Exceptional 16.4% |
| Lebanese | 99.6 /100 | #51 | Exceptional 16.4% |
| Welsh | 99.6 /100 | #52 | Exceptional 16.4% |
| Slovenes | 99.6 /100 | #53 | Exceptional 16.4% |
| British | 99.5 /100 | #54 | Exceptional 16.5% |
| Czechoslovakians | 99.5 /100 | #55 | Exceptional 16.5% |
| Sri Lankans | 99.5 /100 | #56 | Exceptional 16.5% |
| Immigrants | Jordan | 99.4 /100 | #57 | Exceptional 16.5% |
| Immigrants | Uganda | 99.4 /100 | #58 | Exceptional 16.5% |
| Irish | 99.4 /100 | #59 | Exceptional 16.5% |
| Menominee | 99.3 /100 | #60 | Exceptional 16.6% |
| Immigrants | Cuba | 99.2 /100 | #61 | Exceptional 16.6% |
| Macedonians | 99.2 /100 | #62 | Exceptional 16.6% |
| Scotch-Irish | 99.1 /100 | #63 | Exceptional 16.6% |
| Northern Europeans | 99.0 /100 | #64 | Exceptional 16.6% |
| Immigrants | Japan | 98.9 /100 | #65 | Exceptional 16.6% |
| Okinawans | 98.9 /100 | #66 | Exceptional 16.6% |
| Slavs | 98.7 /100 | #67 | Exceptional 16.7% |
| Chickasaw | 98.7 /100 | #68 | Exceptional 16.7% |