Immigrants from Japan vs Hungarian Child Poverty Among Girls Under 16
COMPARE
Immigrants from Japan
Hungarian
Child Poverty Among Girls Under 16
Child Poverty Among Girls Under 16 Comparison
Immigrants from Japan
Hungarians
13.3%
CHILD POVERTY AMONG GIRLS UNDER 16
99.9/ 100
METRIC RATING
20th/ 347
METRIC RANK
16.6%
CHILD POVERTY AMONG GIRLS UNDER 16
45.1/ 100
METRIC RATING
176th/ 347
METRIC RANK
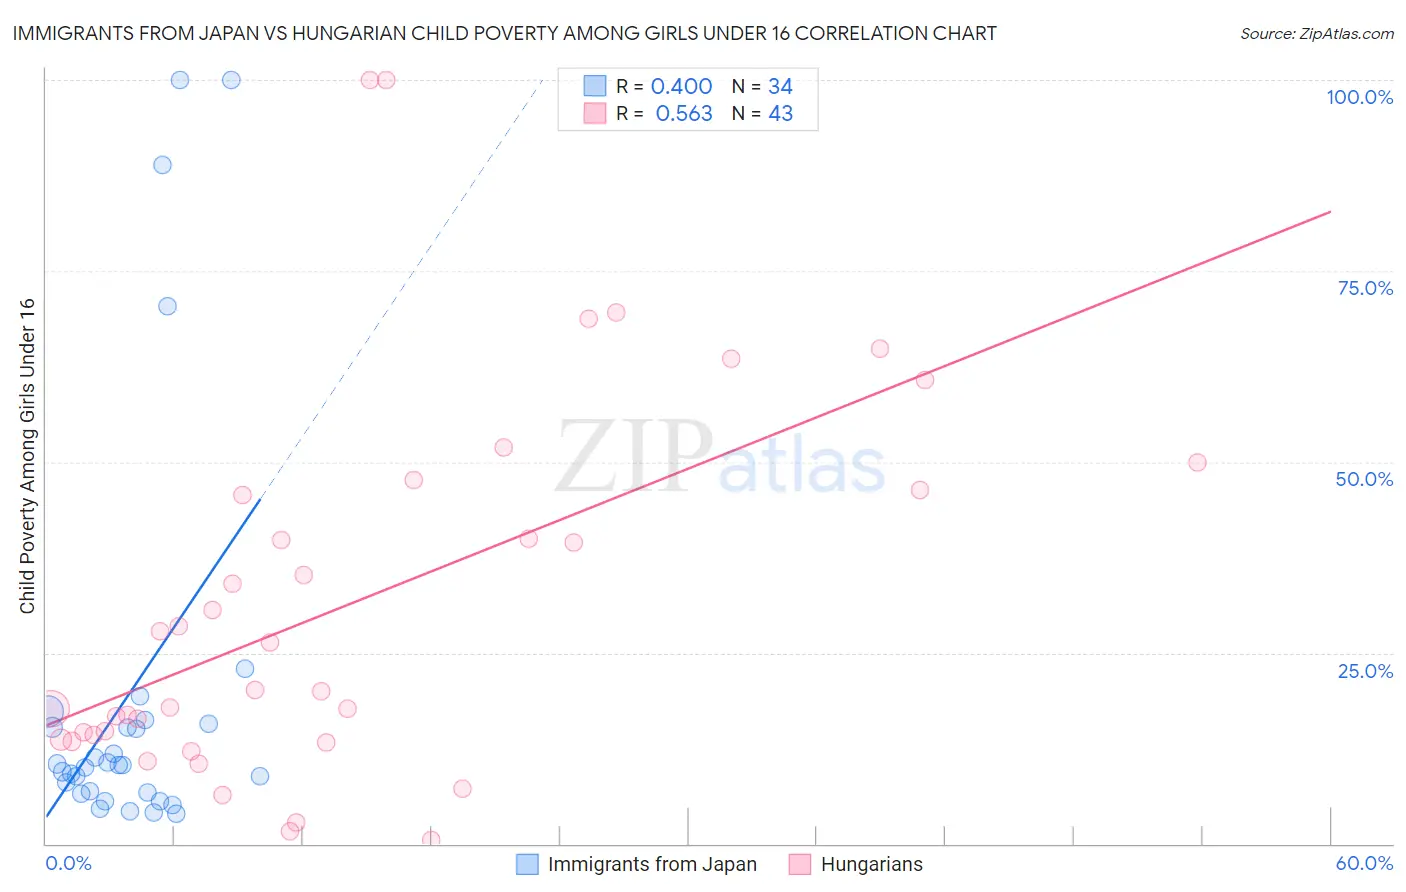
Immigrants from Japan vs Hungarian Child Poverty Among Girls Under 16 Correlation Chart
The statistical analysis conducted on geographies consisting of 334,926,673 people shows a moderate positive correlation between the proportion of Immigrants from Japan and poverty level among girls under the age of 16 in the United States with a correlation coefficient (R) of 0.400 and weighted average of 13.3%. Similarly, the statistical analysis conducted on geographies consisting of 471,414,008 people shows a substantial positive correlation between the proportion of Hungarians and poverty level among girls under the age of 16 in the United States with a correlation coefficient (R) of 0.563 and weighted average of 16.6%, a difference of 24.7%.
Child Poverty Among Girls Under 16 Correlation Summary
| Measurement | Immigrants from Japan | Hungarian |
| Minimum | 3.9% | 0.46% |
| Maximum | 100.0% | 100.0% |
| Range | 96.1% | 99.5% |
| Mean | 19.7% | 31.4% |
| Median | 10.3% | 20.1% |
| Interquartile 25% (IQ1) | 6.7% | 13.6% |
| Interquartile 75% (IQ3) | 15.7% | 46.3% |
| Interquartile Range (IQR) | 9.1% | 32.7% |
| Standard Deviation (Sample) | 26.7% | 24.6% |
| Standard Deviation (Population) | 26.4% | 24.3% |
Similar Demographics by Child Poverty Among Girls Under 16
Demographics Similar to Immigrants from Japan by Child Poverty Among Girls Under 16
In terms of child poverty among girls under 16, the demographic groups most similar to Immigrants from Japan are Assyrian/Chaldean/Syriac (13.3%, a difference of 0.12%), Indian (Asian) (13.3%, a difference of 0.32%), Norwegian (13.3%, a difference of 0.49%), Immigrants from Eastern Asia (13.4%, a difference of 0.58%), and Cypriot (13.2%, a difference of 0.66%).
| Demographics | Rating | Rank | Child Poverty Among Girls Under 16 |
| Immigrants | Ireland | 99.9 /100 | #13 | Exceptional 12.9% |
| Burmese | 99.9 /100 | #14 | Exceptional 13.0% |
| Okinawans | 99.9 /100 | #15 | Exceptional 13.0% |
| Immigrants | Lithuania | 99.9 /100 | #16 | Exceptional 13.1% |
| Bulgarians | 99.9 /100 | #17 | Exceptional 13.1% |
| Immigrants | Korea | 99.9 /100 | #18 | Exceptional 13.1% |
| Cypriots | 99.9 /100 | #19 | Exceptional 13.2% |
| Immigrants | Japan | 99.9 /100 | #20 | Exceptional 13.3% |
| Assyrians/Chaldeans/Syriacs | 99.9 /100 | #21 | Exceptional 13.3% |
| Indians (Asian) | 99.9 /100 | #22 | Exceptional 13.3% |
| Norwegians | 99.9 /100 | #23 | Exceptional 13.3% |
| Immigrants | Eastern Asia | 99.9 /100 | #24 | Exceptional 13.4% |
| Immigrants | China | 99.8 /100 | #25 | Exceptional 13.4% |
| Eastern Europeans | 99.8 /100 | #26 | Exceptional 13.5% |
| Latvians | 99.8 /100 | #27 | Exceptional 13.5% |
Demographics Similar to Hungarians by Child Poverty Among Girls Under 16
In terms of child poverty among girls under 16, the demographic groups most similar to Hungarians are Lebanese (16.6%, a difference of 0.030%), Immigrants from Western Asia (16.6%, a difference of 0.11%), White/Caucasian (16.6%, a difference of 0.17%), Hawaiian (16.6%, a difference of 0.20%), and Immigrants from Syria (16.6%, a difference of 0.21%).
| Demographics | Rating | Rank | Child Poverty Among Girls Under 16 |
| Costa Ricans | 64.2 /100 | #169 | Good 16.2% |
| Immigrants | Venezuela | 64.2 /100 | #170 | Good 16.2% |
| Immigrants | Saudi Arabia | 64.0 /100 | #171 | Good 16.2% |
| Afghans | 62.3 /100 | #172 | Good 16.2% |
| Immigrants | South America | 55.1 /100 | #173 | Average 16.4% |
| Ethiopians | 50.0 /100 | #174 | Average 16.5% |
| Lebanese | 45.4 /100 | #175 | Average 16.6% |
| Hungarians | 45.1 /100 | #176 | Average 16.6% |
| Immigrants | Western Asia | 44.1 /100 | #177 | Average 16.6% |
| Whites/Caucasians | 43.6 /100 | #178 | Average 16.6% |
| Hawaiians | 43.4 /100 | #179 | Average 16.6% |
| Immigrants | Syria | 43.3 /100 | #180 | Average 16.6% |
| Immigrants | Iraq | 43.2 /100 | #181 | Average 16.6% |
| Immigrants | Ethiopia | 43.1 /100 | #182 | Average 16.6% |
| Immigrants | Portugal | 42.5 /100 | #183 | Average 16.6% |