Immigrants from Japan vs Hungarian Median Earnings
COMPARE
Immigrants from Japan
Hungarian
Median Earnings
Median Earnings Comparison
Immigrants from Japan
Hungarians
$54,938
MEDIAN EARNINGS
100.0/ 100
METRIC RATING
18th/ 347
METRIC RANK
$47,795
MEDIAN EARNINGS
87.1/ 100
METRIC RATING
144th/ 347
METRIC RANK
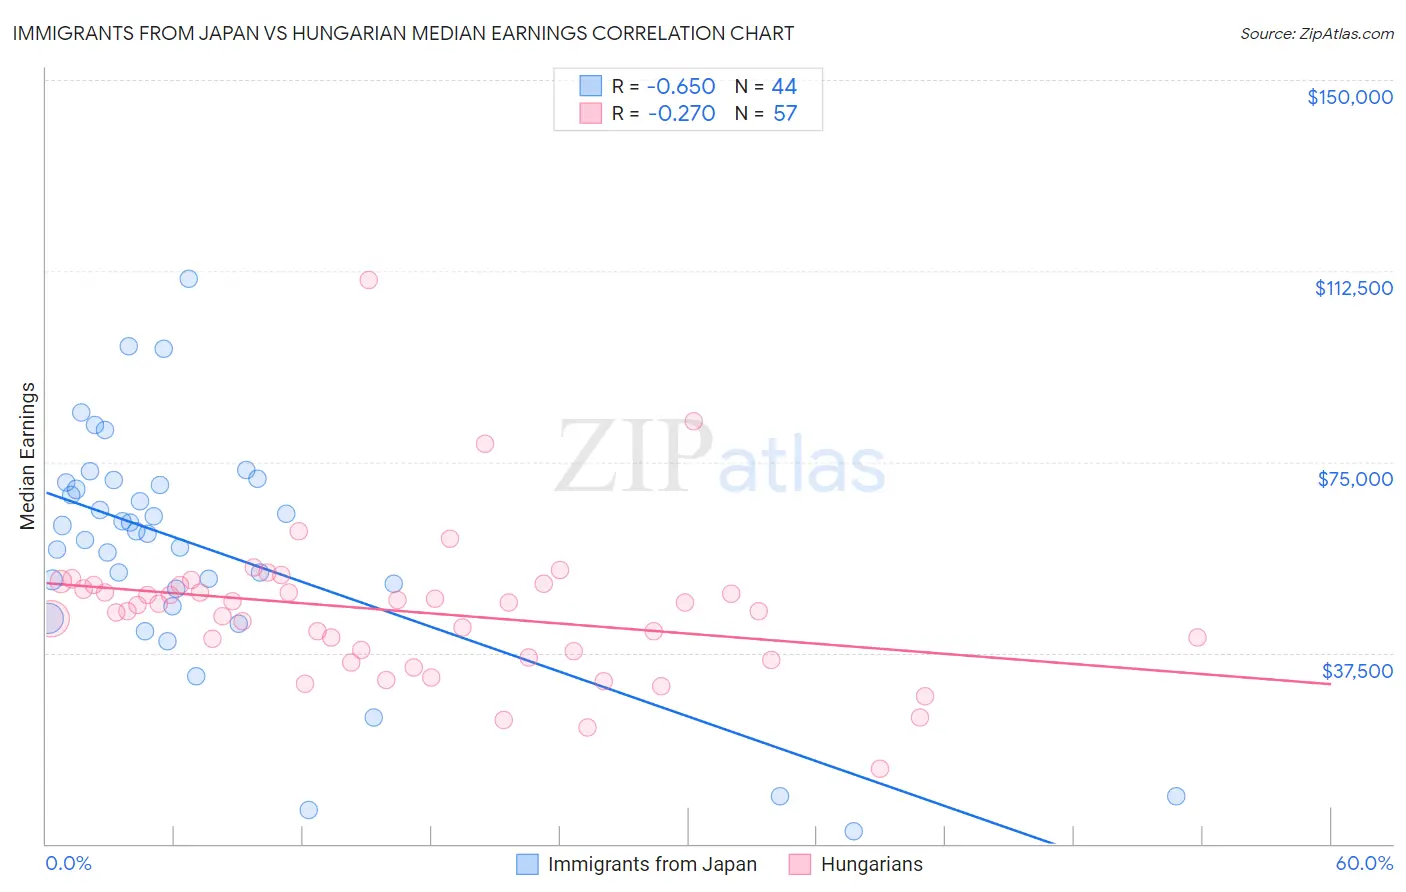
Immigrants from Japan vs Hungarian Median Earnings Correlation Chart
The statistical analysis conducted on geographies consisting of 340,132,421 people shows a significant negative correlation between the proportion of Immigrants from Japan and median earnings in the United States with a correlation coefficient (R) of -0.650 and weighted average of $54,938. Similarly, the statistical analysis conducted on geographies consisting of 486,158,969 people shows a weak negative correlation between the proportion of Hungarians and median earnings in the United States with a correlation coefficient (R) of -0.270 and weighted average of $47,795, a difference of 14.9%.
Median Earnings Correlation Summary
| Measurement | Immigrants from Japan | Hungarian |
| Minimum | $2,499 | $14,721 |
| Maximum | $110,893 | $110,790 |
| Range | $108,394 | $96,069 |
| Mean | $57,767 | $45,677 |
| Median | $61,115 | $46,823 |
| Interquartile 25% (IQ1) | $48,389 | $37,180 |
| Interquartile 75% (IQ3) | $70,647 | $50,813 |
| Interquartile Range (IQR) | $22,258 | $13,633 |
| Standard Deviation (Sample) | $23,135 | $14,634 |
| Standard Deviation (Population) | $22,870 | $14,505 |
Similar Demographics by Median Earnings
Demographics Similar to Immigrants from Japan by Median Earnings
In terms of median earnings, the demographic groups most similar to Immigrants from Japan are Eastern European ($55,084, a difference of 0.26%), Immigrants from Belgium ($54,679, a difference of 0.47%), Cypriot ($54,589, a difference of 0.64%), Burmese ($54,559, a difference of 0.69%), and Immigrants from Korea ($54,530, a difference of 0.75%).
| Demographics | Rating | Rank | Median Earnings |
| Immigrants | Israel | 100.0 /100 | #11 | Exceptional $57,034 |
| Immigrants | Ireland | 100.0 /100 | #12 | Exceptional $56,854 |
| Immigrants | China | 100.0 /100 | #13 | Exceptional $56,638 |
| Immigrants | Australia | 100.0 /100 | #14 | Exceptional $56,305 |
| Indians (Asian) | 100.0 /100 | #15 | Exceptional $56,253 |
| Immigrants | Eastern Asia | 100.0 /100 | #16 | Exceptional $56,183 |
| Eastern Europeans | 100.0 /100 | #17 | Exceptional $55,084 |
| Immigrants | Japan | 100.0 /100 | #18 | Exceptional $54,938 |
| Immigrants | Belgium | 100.0 /100 | #19 | Exceptional $54,679 |
| Cypriots | 100.0 /100 | #20 | Exceptional $54,589 |
| Burmese | 100.0 /100 | #21 | Exceptional $54,559 |
| Immigrants | Korea | 100.0 /100 | #22 | Exceptional $54,530 |
| Immigrants | Sweden | 100.0 /100 | #23 | Exceptional $54,478 |
| Soviet Union | 100.0 /100 | #24 | Exceptional $54,290 |
| Turks | 100.0 /100 | #25 | Exceptional $53,919 |
Demographics Similar to Hungarians by Median Earnings
In terms of median earnings, the demographic groups most similar to Hungarians are Ugandan ($47,854, a difference of 0.12%), Swedish ($47,851, a difference of 0.12%), Immigrants from Sierra Leone ($47,875, a difference of 0.17%), Immigrants from Saudi Arabia ($47,704, a difference of 0.19%), and Immigrants from Chile ($47,697, a difference of 0.21%).
| Demographics | Rating | Rank | Median Earnings |
| Immigrants | Nepal | 89.0 /100 | #137 | Excellent $47,925 |
| Europeans | 88.9 /100 | #138 | Excellent $47,915 |
| Canadians | 88.8 /100 | #139 | Excellent $47,911 |
| Taiwanese | 88.7 /100 | #140 | Excellent $47,902 |
| Immigrants | Sierra Leone | 88.3 /100 | #141 | Excellent $47,875 |
| Ugandans | 88.0 /100 | #142 | Excellent $47,854 |
| Swedes | 88.0 /100 | #143 | Excellent $47,851 |
| Hungarians | 87.1 /100 | #144 | Excellent $47,795 |
| Immigrants | Saudi Arabia | 85.6 /100 | #145 | Excellent $47,704 |
| Immigrants | Chile | 85.5 /100 | #146 | Excellent $47,697 |
| Immigrants | South Eastern Asia | 85.0 /100 | #147 | Excellent $47,671 |
| Immigrants | Eritrea | 84.8 /100 | #148 | Excellent $47,657 |
| Luxembourgers | 84.5 /100 | #149 | Excellent $47,640 |
| Peruvians | 84.2 /100 | #150 | Excellent $47,628 |
| Immigrants | Oceania | 84.1 /100 | #151 | Excellent $47,617 |