French Canadian vs Guyanese Family Poverty
COMPARE
French Canadian
Guyanese
Family Poverty
Family Poverty Comparison
French Canadians
Guyanese
8.1%
FAMILY POVERTY
95.0/ 100
METRIC RATING
107th/ 347
METRIC RANK
11.2%
FAMILY POVERTY
0.1/ 100
METRIC RATING
278th/ 347
METRIC RANK
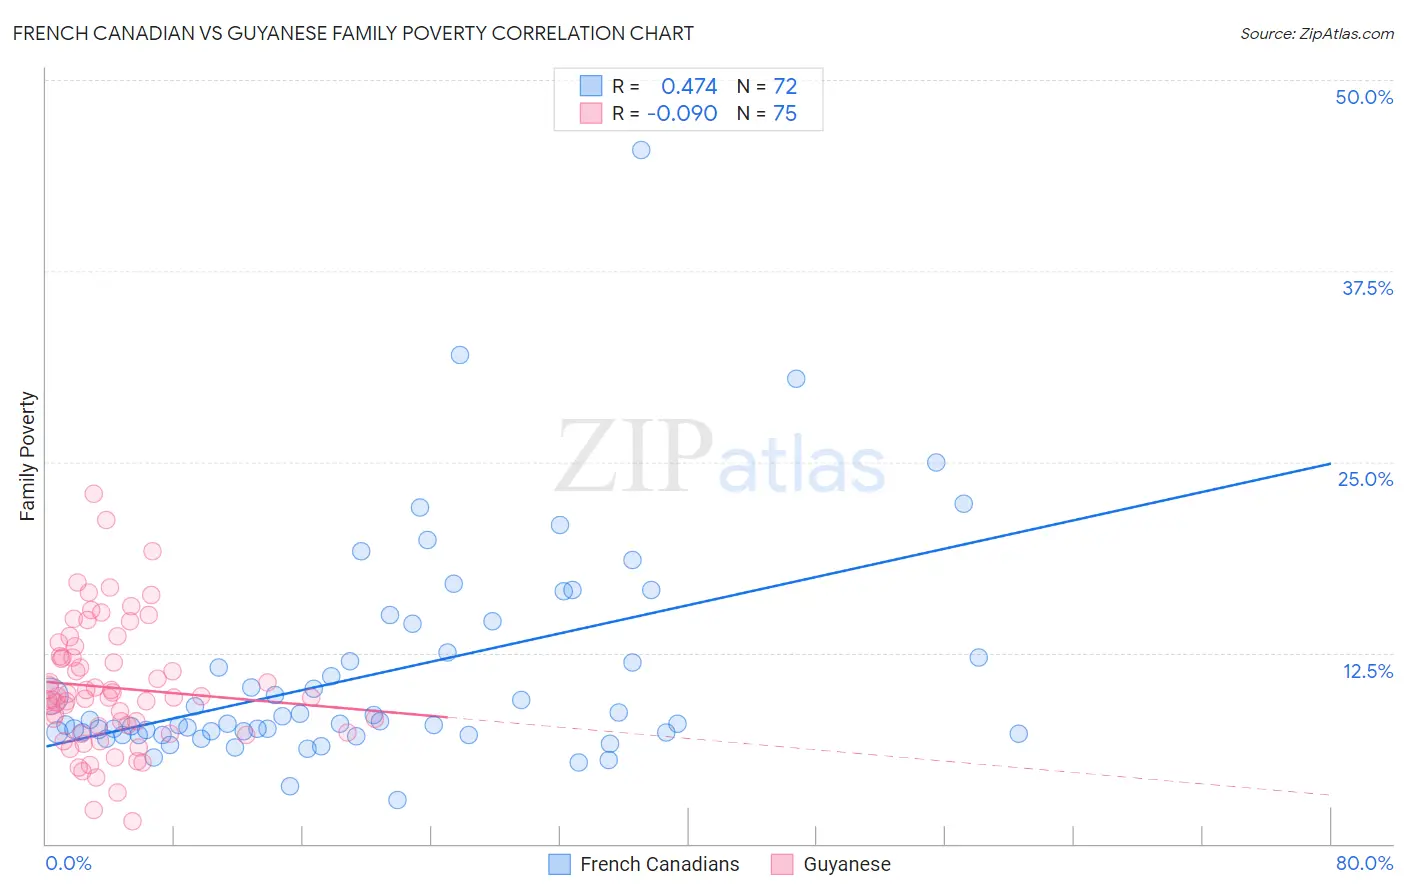
French Canadian vs Guyanese Family Poverty Correlation Chart
The statistical analysis conducted on geographies consisting of 499,881,871 people shows a moderate positive correlation between the proportion of French Canadians and poverty level among families in the United States with a correlation coefficient (R) of 0.474 and weighted average of 8.1%. Similarly, the statistical analysis conducted on geographies consisting of 176,578,475 people shows a slight negative correlation between the proportion of Guyanese and poverty level among families in the United States with a correlation coefficient (R) of -0.090 and weighted average of 11.2%, a difference of 38.1%.
Family Poverty Correlation Summary
| Measurement | French Canadian | Guyanese |
| Minimum | 2.9% | 1.5% |
| Maximum | 45.5% | 22.9% |
| Range | 42.6% | 21.5% |
| Mean | 11.1% | 10.2% |
| Median | 7.9% | 9.6% |
| Interquartile 25% (IQ1) | 7.2% | 7.3% |
| Interquartile 75% (IQ3) | 12.3% | 12.3% |
| Interquartile Range (IQR) | 5.1% | 4.9% |
| Standard Deviation (Sample) | 7.2% | 4.2% |
| Standard Deviation (Population) | 7.1% | 4.1% |
Similar Demographics by Family Poverty
Demographics Similar to French Canadians by Family Poverty
In terms of family poverty, the demographic groups most similar to French Canadians are Egyptian (8.1%, a difference of 0.040%), Basque (8.1%, a difference of 0.090%), Jordanian (8.2%, a difference of 0.18%), Romanian (8.2%, a difference of 0.27%), and Taiwanese (8.2%, a difference of 0.32%).
| Demographics | Rating | Rank | Family Poverty |
| New Zealanders | 95.8 /100 | #100 | Exceptional 8.1% |
| Immigrants | Norway | 95.7 /100 | #101 | Exceptional 8.1% |
| Immigrants | Indonesia | 95.7 /100 | #102 | Exceptional 8.1% |
| Immigrants | Eastern Europe | 95.6 /100 | #103 | Exceptional 8.1% |
| Slavs | 95.6 /100 | #104 | Exceptional 8.1% |
| Laotians | 95.6 /100 | #105 | Exceptional 8.1% |
| Egyptians | 95.1 /100 | #106 | Exceptional 8.1% |
| French Canadians | 95.0 /100 | #107 | Exceptional 8.1% |
| Basques | 94.9 /100 | #108 | Exceptional 8.1% |
| Jordanians | 94.8 /100 | #109 | Exceptional 8.2% |
| Romanians | 94.7 /100 | #110 | Exceptional 8.2% |
| Taiwanese | 94.6 /100 | #111 | Exceptional 8.2% |
| Immigrants | France | 94.4 /100 | #112 | Exceptional 8.2% |
| Canadians | 94.2 /100 | #113 | Exceptional 8.2% |
| Immigrants | Zimbabwe | 94.0 /100 | #114 | Exceptional 8.2% |
Demographics Similar to Guyanese by Family Poverty
In terms of family poverty, the demographic groups most similar to Guyanese are Chippewa (11.2%, a difference of 0.030%), Immigrants from Guyana (11.2%, a difference of 0.12%), Central American (11.2%, a difference of 0.14%), Blackfeet (11.3%, a difference of 0.14%), and Belizean (11.3%, a difference of 0.18%).
| Demographics | Rating | Rank | Family Poverty |
| Immigrants | Bahamas | 0.1 /100 | #271 | Tragic 11.1% |
| Immigrants | Jamaica | 0.1 /100 | #272 | Tragic 11.2% |
| Somalis | 0.1 /100 | #273 | Tragic 11.2% |
| Spanish Americans | 0.1 /100 | #274 | Tragic 11.2% |
| Central Americans | 0.1 /100 | #275 | Tragic 11.2% |
| Immigrants | Guyana | 0.1 /100 | #276 | Tragic 11.2% |
| Chippewa | 0.1 /100 | #277 | Tragic 11.2% |
| Guyanese | 0.1 /100 | #278 | Tragic 11.2% |
| Blackfeet | 0.0 /100 | #279 | Tragic 11.3% |
| Belizeans | 0.0 /100 | #280 | Tragic 11.3% |
| Immigrants | West Indies | 0.0 /100 | #281 | Tragic 11.3% |
| Immigrants | Cuba | 0.0 /100 | #282 | Tragic 11.3% |
| Indonesians | 0.0 /100 | #283 | Tragic 11.3% |
| Yaqui | 0.0 /100 | #284 | Tragic 11.3% |
| Barbadians | 0.0 /100 | #285 | Tragic 11.3% |