Immigrants from Israel vs Serbian Single Mother Poverty

COMPARE

Immigrants from Israel
Race
Ancestry
AfghanAfricanAlaska NativeAlaskan AthabascanAlbanianAleutAlsatianAmericanApacheArabArapahoArgentineanArmenianAssyrian/Chaldean/SyriacAustralianAustrianBahamianBangladeshiBarbadianBasqueBelgianBelizeanBermudanBhutaneseBlackfeetBolivianBrazilianBritishBritish West IndianBulgarianBurmeseCajunCambodianCanadianCape VerdeanCarpatho RusynCelticCentral AmericanCentral American IndianCherokeeCheyenneChickasawChileanChineseChippewaChoctawColombianColvilleComancheCosta RicanCreeCreekCroatianCrowCubanCypriotCzechCzechoslovakianDanishDelawareDominicanDutchDutch West IndianEastern EuropeanEcuadorianEgyptianEnglishEstonianEthiopianEuropeanFijianFilipinoFinnishFrenchFrench American IndianFrench CanadianGermanGerman RussianGhanaianGreekGuamanian/ChamorroGuatemalanGuyaneseHaitianHmongHonduranHopiHoumaHungarianIcelanderIndian (Asian)IndonesianInupiatIranianIraqiIrishIroquoisIsraeliItalianJamaicanJapaneseJordanianKenyanKiowaKoreanLaotianLatvianLebaneseLiberianLithuanianLumbeeLuxembourgerMacedonianMalaysianMalteseMarshalleseMenomineeMexicanMexican American IndianMongolianMoroccanNative HawaiianNavajoNepaleseNew ZealanderNicaraguanNigerianNorthern EuropeanNorwegianOkinawanOsageOttawaPaiutePakistaniPalestinianPanamanianParaguayanPennsylvania GermanPeruvianPimaPolishPortuguesePotawatomiPuebloPuerto RicanPuget Sound SalishRomanianRussianSalvadoranSamoanScandinavianScotch-IrishScottishSeminoleSenegaleseShoshoneSierra LeoneanSiouxSlavicSlovakSloveneSomaliSouth AfricanSouth AmericanSouth American IndianSoviet UnionSpaniardSpanishSpanish AmericanSpanish American IndianSri LankanSubsaharan AfricanSudaneseSwedishSwissSyrianTaiwaneseThaiTlingit-HaidaTohono O'OdhamTonganTrinidadian and TobagonianTsimshianTurkishU.S. Virgin IslanderUgandanUkrainianUruguayanUteVenezuelanVietnameseWelshWest IndianYakamaYaquiYugoslavianYumanYup'ikZimbabwean
Immigration
NonimmigrantsImmigrantsAfghanistanAfricaAlbaniaArgentinaArmeniaAsiaAustraliaAustriaBahamasBangladeshBarbadosBelarusBelgiumBelizeBoliviaBosnia and HerzegovinaBrazilBulgariaBurma/MyanmarCabo VerdeCambodiaCameroonCanadaCaribbeanCentral AmericaChileChinaColombiaCongoCosta RicaCroatiaCubaCzechoslovakiaDenmarkDominicaDominican RepublicEastern AfricaEastern AsiaEastern EuropeEcuadorEgyptEl SalvadorEnglandEritreaEthiopiaEuropeFijiFranceGermanyGhanaGreeceGrenadaGuatemalaGuyanaHaitiHondurasHong KongHungaryIndiaIndonesiaIranIraqIrelandIsraelItalyJamaicaJapanJordanKazakhstanKenyaKoreaKuwaitLaosLatin AmericaLatviaLebanonLiberiaLithuaniaMalaysiaMexicoMicronesiaMiddle AfricaMoldovaMoroccoNepalNetherlandsNicaraguaNigeriaNorth AmericaNorth MacedoniaNorthern AfricaNorthern EuropeNorwayOceaniaPakistanPanamaPeruPhilippinesPolandPortugalRomaniaRussiaSaudi ArabiaScotlandSenegalSerbiaSierra LeoneSingaporeSomaliaSouth AfricaSouth AmericaSouth Central AsiaSouth Eastern AsiaSouthern EuropeSpainSri LankaSt. Vincent and the GrenadinesSudanSwedenSwitzerlandSyriaTaiwanThailandTrinidad and TobagoTurkeyUgandaUkraineUruguayUzbekistanVenezuelaVietnamWest IndiesWestern AfricaWestern AsiaWestern EuropeYemenZaireZimbabweAzores
Serbian
Race
Ancestry
AfghanAfricanAlaska NativeAlaskan AthabascanAlbanianAleutAlsatianAmericanApacheArabArapahoArgentineanArmenianAssyrian/Chaldean/SyriacAustralianAustrianBahamianBangladeshiBarbadianBasqueBelgianBelizeanBermudanBhutaneseBlackfeetBolivianBrazilianBritishBritish West IndianBulgarianBurmeseCajunCambodianCanadianCape VerdeanCarpatho RusynCelticCentral AmericanCentral American IndianCherokeeCheyenneChickasawChileanChineseChippewaChoctawColombianColvilleComancheCosta RicanCreeCreekCroatianCrowCubanCypriotCzechCzechoslovakianDanishDelawareDominicanDutchDutch West IndianEastern EuropeanEcuadorianEgyptianEnglishEstonianEthiopianEuropeanFijianFilipinoFinnishFrenchFrench American IndianFrench CanadianGermanGerman RussianGhanaianGreekGuamanian/ChamorroGuatemalanGuyaneseHaitianHmongHonduranHopiHoumaHungarianIcelanderIndian (Asian)IndonesianInupiatIranianIraqiIrishIroquoisIsraeliItalianJamaicanJapaneseJordanianKenyanKiowaKoreanLaotianLatvianLebaneseLiberianLithuanianLumbeeLuxembourgerMacedonianMalaysianMalteseMarshalleseMenomineeMexicanMexican American IndianMongolianMoroccanNative HawaiianNavajoNepaleseNew ZealanderNicaraguanNigerianNorthern EuropeanNorwegianOkinawanOsageOttawaPaiutePakistaniPalestinianPanamanianParaguayanPennsylvania GermanPeruvianPimaPolishPortuguesePotawatomiPuebloPuerto RicanPuget Sound SalishRomanianRussianSalvadoranSamoanScandinavianScotch-IrishScottishSeminoleSenegaleseSerbianShoshoneSierra LeoneanSiouxSlavicSlovakSloveneSomaliSouth AfricanSouth AmericanSouth American IndianSoviet UnionSpaniardSpanishSpanish AmericanSpanish American IndianSri LankanSubsaharan AfricanSudaneseSwedishSwissSyrianTaiwaneseThaiTlingit-HaidaTohono O'OdhamTonganTrinidadian and TobagonianTsimshianTurkishU.S. Virgin IslanderUgandanUkrainianUruguayanUteVenezuelanVietnameseWelshWest IndianYakamaYaquiYugoslavianYumanYup'ikZimbabwean
Immigration
NonimmigrantsImmigrantsAfghanistanAfricaAlbaniaArgentinaArmeniaAsiaAustraliaAustriaBahamasBangladeshBarbadosBelarusBelgiumBelizeBoliviaBosnia and HerzegovinaBrazilBulgariaBurma/MyanmarCabo VerdeCambodiaCameroonCanadaCaribbeanCentral AmericaChileChinaColombiaCongoCosta RicaCroatiaCubaCzechoslovakiaDenmarkDominicaDominican RepublicEastern AfricaEastern AsiaEastern EuropeEcuadorEgyptEl SalvadorEnglandEritreaEthiopiaEuropeFijiFranceGermanyGhanaGreeceGrenadaGuatemalaGuyanaHaitiHondurasHong KongHungaryIndiaIndonesiaIranIraqIrelandItalyJamaicaJapanJordanKazakhstanKenyaKoreaKuwaitLaosLatin AmericaLatviaLebanonLiberiaLithuaniaMalaysiaMexicoMicronesiaMiddle AfricaMoldovaMoroccoNepalNetherlandsNicaraguaNigeriaNorth AmericaNorth MacedoniaNorthern AfricaNorthern EuropeNorwayOceaniaPakistanPanamaPeruPhilippinesPolandPortugalRomaniaRussiaSaudi ArabiaScotlandSenegalSerbiaSierra LeoneSingaporeSomaliaSouth AfricaSouth AmericaSouth Central AsiaSouth Eastern AsiaSouthern EuropeSpainSri LankaSt. Vincent and the GrenadinesSudanSwedenSwitzerlandSyriaTaiwanThailandTrinidad and TobagoTurkeyUgandaUkraineUruguayUzbekistanVenezuelaVietnamWest IndiesWestern AfricaWestern AsiaWestern EuropeYemenZaireZimbabweAzores
Single Mother Poverty
Income
Poverty
Unemployment
Labor Participation
Family Structure
Vehicle Availability
Education Level
Disability

Single Mother Poverty Comparison

Immigrants from Israel

Serbians

Exceptional
Excellent
26.6%
SINGLE MOTHER POVERTY
99.9/ 100
METRIC RATING
37th/ 347
METRIC RANK
28.6%
SINGLE MOTHER POVERTY
85.0/ 100
METRIC RATING
149th/ 347
METRIC RANK

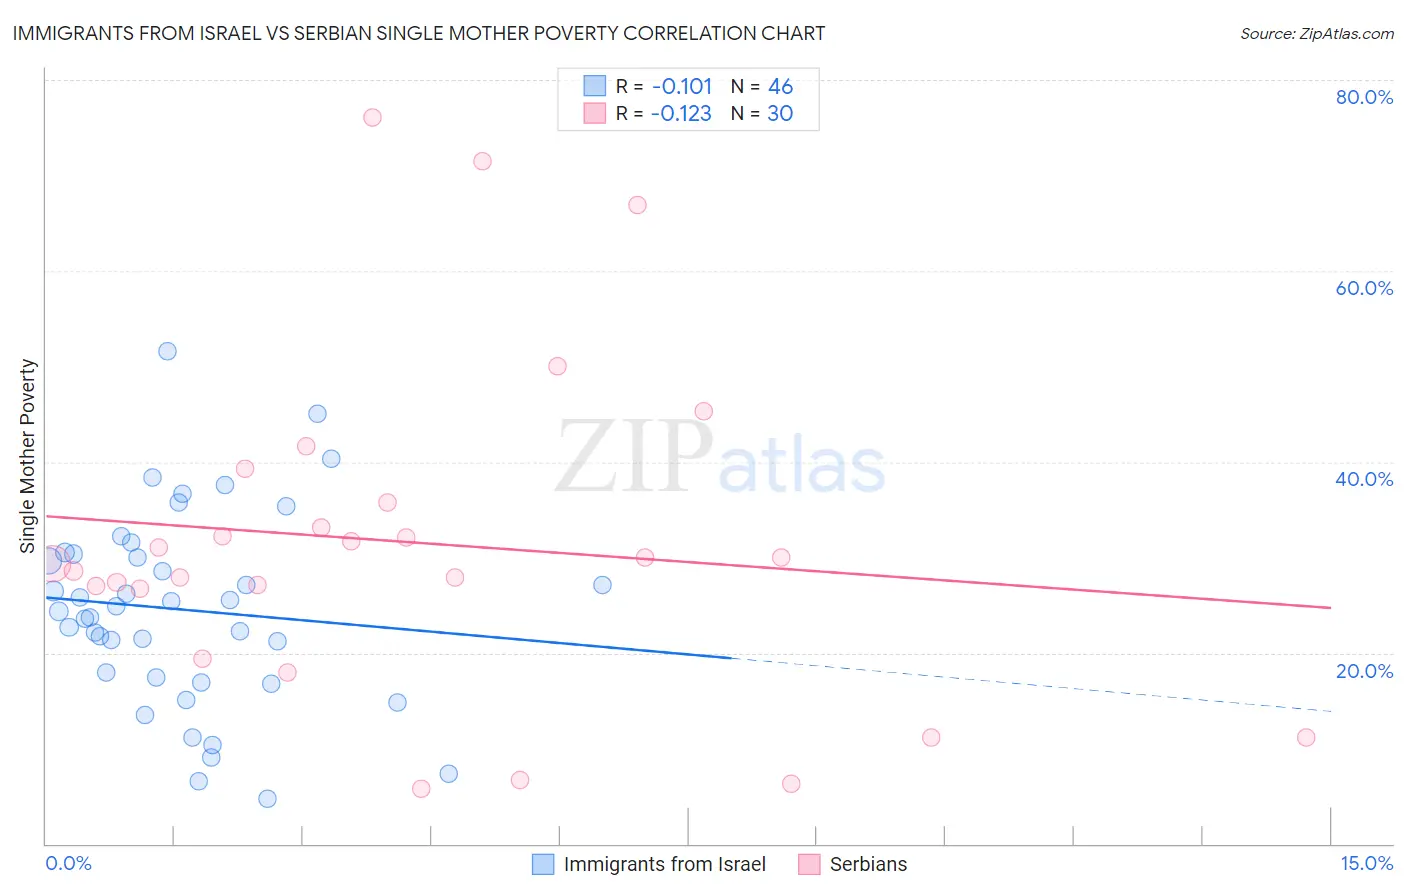
Immigrants from Israel vs Serbian Single Mother Poverty Correlation Chart

The statistical analysis conducted on geographies consisting of 206,012,343 people shows a poor negative correlation between the proportion of Immigrants from Israel and poverty level among single mothers in the United States with a correlation coefficient (R) of -0.101 and weighted average of 26.6%. Similarly, the statistical analysis conducted on geographies consisting of 262,198,183 people shows a poor negative correlation between the proportion of Serbians and poverty level among single mothers in the United States with a correlation coefficient (R) of -0.123 and weighted average of 28.6%, a difference of 7.4%.
Immigrants from Israel vs Serbian Single Mother Poverty

Single Mother Poverty Correlation Summary

MeasurementImmigrants from IsraelSerbian
Minimum4.7%5.8%
Maximum51.6%76.1%
Range46.9%70.4%
Mean24.5%31.6%
Median24.6%29.6%
Interquartile 25% (IQ1)17.4%26.8%
Interquartile 75% (IQ3)30.4%35.8%
Interquartile Range (IQR)13.0%9.0%
Standard Deviation (Sample)10.2%17.4%
Standard Deviation (Population)10.0%17.1%

Similar Demographics by Single Mother Poverty

Demographics Similar to Immigrants from Israel by Single Mother Poverty

In terms of single mother poverty, the demographic groups most similar to Immigrants from Israel are Okinawan (26.6%, a difference of 0.0%), Immigrants from Fiji (26.6%, a difference of 0.040%), Maltese (26.6%, a difference of 0.050%), Immigrants from Indonesia (26.6%, a difference of 0.17%), and Bulgarian (26.5%, a difference of 0.18%).
DemographicsRating | RankSingle Mother Poverty
Turks
100.0
/100
|
#30
Exceptional
26.4%
Immigrants | Philippines
100.0
/100
|
#31
Exceptional
26.5%
Tongans
99.9
/100
|
#32
Exceptional
26.5%
Bulgarians
99.9
/100
|
#33
Exceptional
26.5%
Immigrants | Indonesia
99.9
/100
|
#34
Exceptional
26.6%
Maltese
99.9
/100
|
#35
Exceptional
26.6%
Okinawans
99.9
/100
|
#36
Exceptional
26.6%
Immigrants | Israel
99.9
/100
|
#37
Exceptional
26.6%
Immigrants | Fiji
99.9
/100
|
#38
Exceptional
26.6%
Sri Lankans
99.9
/100
|
#39
Exceptional
26.7%
Immigrants | Vietnam
99.9
/100
|
#40
Exceptional
26.7%
Immigrants | Greece
99.9
/100
|
#41
Exceptional
26.7%
Armenians
99.9
/100
|
#42
Exceptional
26.8%
Tsimshian
99.9
/100
|
#43
Exceptional
26.8%
Immigrants | Sierra Leone
99.9
/100
|
#44
Exceptional
26.9%

Demographics Similar to Serbians by Single Mother Poverty

In terms of single mother poverty, the demographic groups most similar to Serbians are Syrian (28.6%, a difference of 0.020%), Immigrants from Lebanon (28.6%, a difference of 0.030%), Immigrants from Denmark (28.5%, a difference of 0.10%), Immigrants from South America (28.5%, a difference of 0.11%), and Luxembourger (28.5%, a difference of 0.14%).
DemographicsRating | RankSingle Mother Poverty
South Africans
86.6
/100
|
#142
Excellent
28.5%
Immigrants | North America
86.5
/100
|
#143
Excellent
28.5%
Luxembourgers
86.4
/100
|
#144
Excellent
28.5%
Immigrants | South America
86.1
/100
|
#145
Excellent
28.5%
Immigrants | Denmark
86.1
/100
|
#146
Excellent
28.5%
Immigrants | Lebanon
85.3
/100
|
#147
Excellent
28.6%
Syrians
85.3
/100
|
#148
Excellent
28.6%
Serbians
85.0
/100
|
#149
Excellent
28.6%
Northern Europeans
81.7
/100
|
#150
Excellent
28.6%
Immigrants | Oceania
79.9
/100
|
#151
Good
28.7%
Austrians
79.0
/100
|
#152
Good
28.7%
Slovenes
76.4
/100
|
#153
Good
28.8%
Portuguese
73.2
/100
|
#154
Good
28.8%
Ugandans
71.7
/100
|
#155
Good
28.8%
Iraqis
71.5
/100
|
#156
Good
28.8%