Immigrants from Israel vs Ottawa Single Mother Poverty
COMPARE
Immigrants from Israel
Ottawa
Single Mother Poverty
Single Mother Poverty Comparison
Immigrants from Israel
Ottawa
26.6%
SINGLE MOTHER POVERTY
99.9/ 100
METRIC RATING
37th/ 347
METRIC RANK
35.5%
SINGLE MOTHER POVERTY
0.0/ 100
METRIC RATING
324th/ 347
METRIC RANK
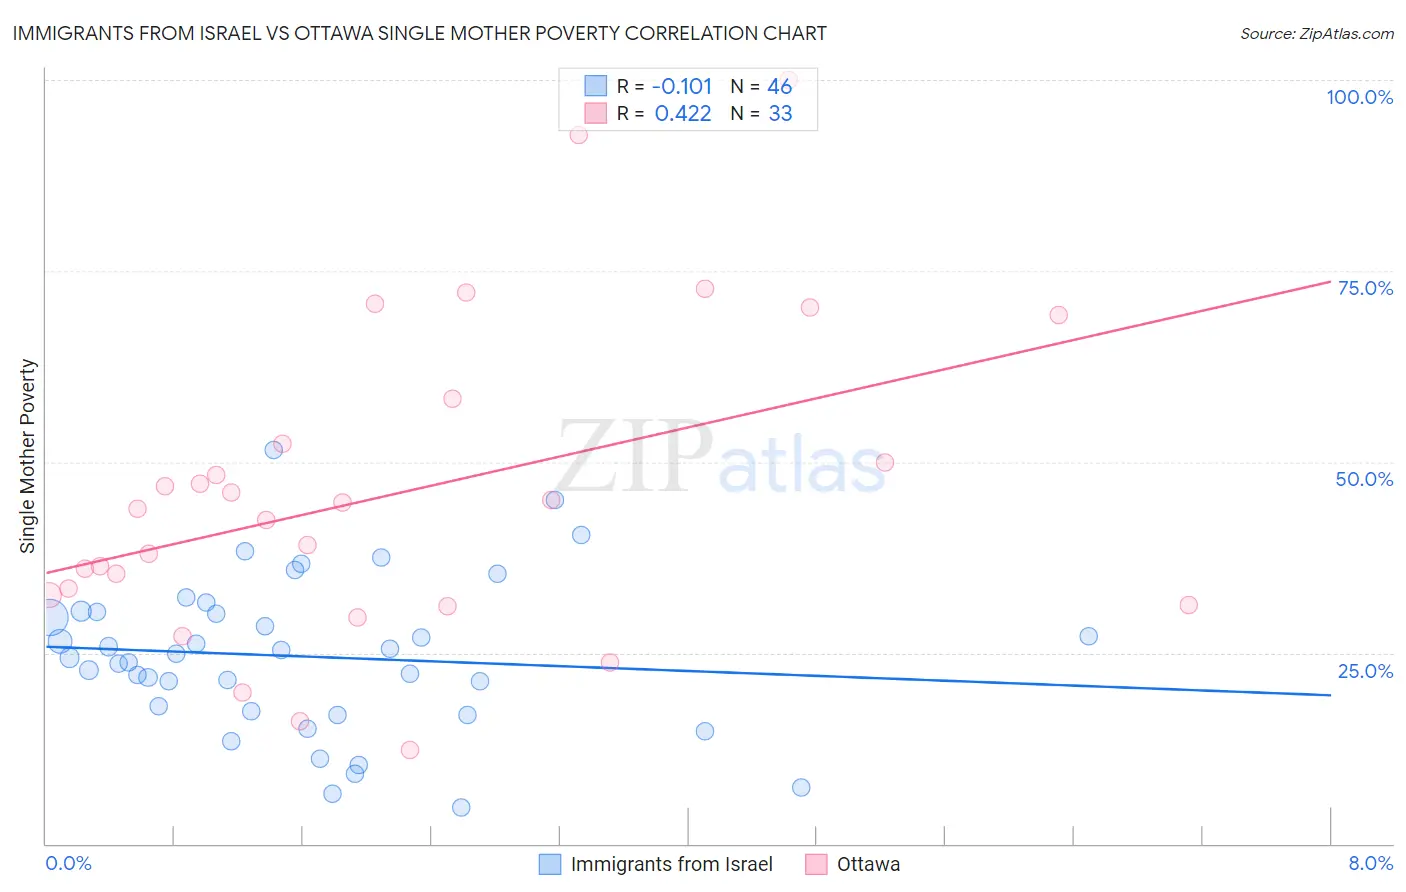
Immigrants from Israel vs Ottawa Single Mother Poverty Correlation Chart
The statistical analysis conducted on geographies consisting of 206,012,343 people shows a poor negative correlation between the proportion of Immigrants from Israel and poverty level among single mothers in the United States with a correlation coefficient (R) of -0.101 and weighted average of 26.6%. Similarly, the statistical analysis conducted on geographies consisting of 49,602,464 people shows a moderate positive correlation between the proportion of Ottawa and poverty level among single mothers in the United States with a correlation coefficient (R) of 0.422 and weighted average of 35.5%, a difference of 33.6%.
Single Mother Poverty Correlation Summary
| Measurement | Immigrants from Israel | Ottawa |
| Minimum | 4.7% | 12.2% |
| Maximum | 51.6% | 100.0% |
| Range | 46.9% | 87.8% |
| Mean | 24.5% | 45.9% |
| Median | 24.6% | 43.8% |
| Interquartile 25% (IQ1) | 17.4% | 31.9% |
| Interquartile 75% (IQ3) | 30.4% | 55.3% |
| Interquartile Range (IQR) | 13.0% | 23.5% |
| Standard Deviation (Sample) | 10.2% | 20.6% |
| Standard Deviation (Population) | 10.0% | 20.3% |
Similar Demographics by Single Mother Poverty
Demographics Similar to Immigrants from Israel by Single Mother Poverty
In terms of single mother poverty, the demographic groups most similar to Immigrants from Israel are Okinawan (26.6%, a difference of 0.0%), Immigrants from Fiji (26.6%, a difference of 0.040%), Maltese (26.6%, a difference of 0.050%), Immigrants from Indonesia (26.6%, a difference of 0.17%), and Bulgarian (26.5%, a difference of 0.18%).
| Demographics | Rating | Rank | Single Mother Poverty |
| Turks | 100.0 /100 | #30 | Exceptional 26.4% |
| Immigrants | Philippines | 100.0 /100 | #31 | Exceptional 26.5% |
| Tongans | 99.9 /100 | #32 | Exceptional 26.5% |
| Bulgarians | 99.9 /100 | #33 | Exceptional 26.5% |
| Immigrants | Indonesia | 99.9 /100 | #34 | Exceptional 26.6% |
| Maltese | 99.9 /100 | #35 | Exceptional 26.6% |
| Okinawans | 99.9 /100 | #36 | Exceptional 26.6% |
| Immigrants | Israel | 99.9 /100 | #37 | Exceptional 26.6% |
| Immigrants | Fiji | 99.9 /100 | #38 | Exceptional 26.6% |
| Sri Lankans | 99.9 /100 | #39 | Exceptional 26.7% |
| Immigrants | Vietnam | 99.9 /100 | #40 | Exceptional 26.7% |
| Immigrants | Greece | 99.9 /100 | #41 | Exceptional 26.7% |
| Armenians | 99.9 /100 | #42 | Exceptional 26.8% |
| Tsimshian | 99.9 /100 | #43 | Exceptional 26.8% |
| Immigrants | Sierra Leone | 99.9 /100 | #44 | Exceptional 26.9% |
Demographics Similar to Ottawa by Single Mother Poverty
In terms of single mother poverty, the demographic groups most similar to Ottawa are Kiowa (35.5%, a difference of 0.21%), Ute (35.7%, a difference of 0.48%), Seminole (35.8%, a difference of 0.78%), Black/African American (35.2%, a difference of 0.92%), and Paiute (35.1%, a difference of 1.1%).
| Demographics | Rating | Rank | Single Mother Poverty |
| Cherokee | 0.0 /100 | #317 | Tragic 34.5% |
| Immigrants | Honduras | 0.0 /100 | #318 | Tragic 34.7% |
| Chippewa | 0.0 /100 | #319 | Tragic 34.8% |
| Iroquois | 0.0 /100 | #320 | Tragic 34.8% |
| Paiute | 0.0 /100 | #321 | Tragic 35.1% |
| Blacks/African Americans | 0.0 /100 | #322 | Tragic 35.2% |
| Kiowa | 0.0 /100 | #323 | Tragic 35.5% |
| Ottawa | 0.0 /100 | #324 | Tragic 35.5% |
| Ute | 0.0 /100 | #325 | Tragic 35.7% |
| Seminole | 0.0 /100 | #326 | Tragic 35.8% |
| Yakama | 0.0 /100 | #327 | Tragic 36.4% |
| Choctaw | 0.0 /100 | #328 | Tragic 36.4% |
| Apache | 0.0 /100 | #329 | Tragic 36.6% |
| Natives/Alaskans | 0.0 /100 | #330 | Tragic 36.6% |
| Creek | 0.0 /100 | #331 | Tragic 36.7% |