Central American Indian vs Serbian Single Mother Poverty
COMPARE
Central American Indian
Serbian
Single Mother Poverty
Single Mother Poverty Comparison
Central American Indians
Serbians
34.3%
SINGLE MOTHER POVERTY
0.0/ 100
METRIC RATING
312th/ 347
METRIC RANK
28.6%
SINGLE MOTHER POVERTY
85.0/ 100
METRIC RATING
149th/ 347
METRIC RANK
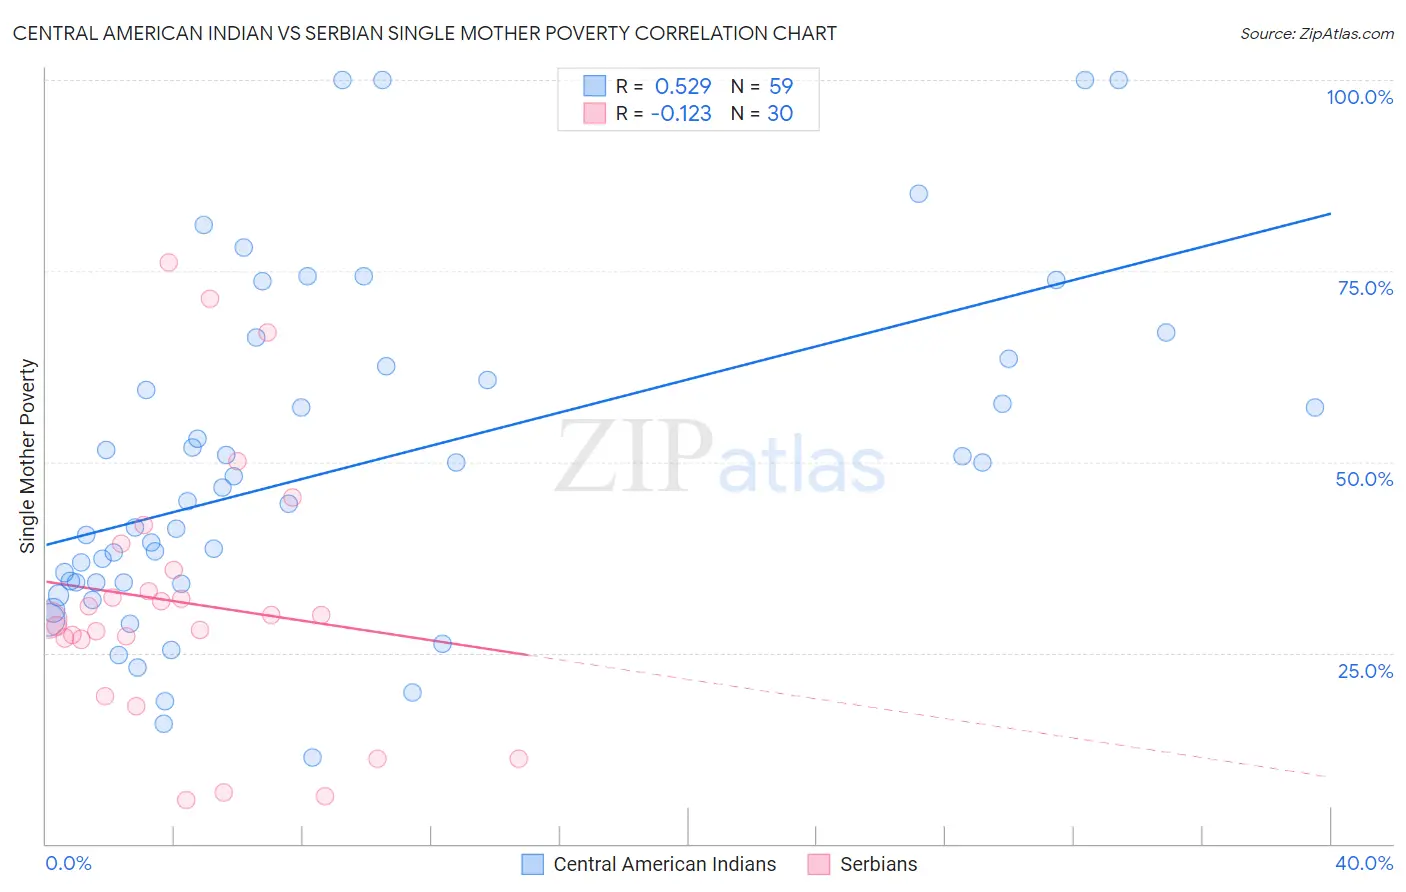
Central American Indian vs Serbian Single Mother Poverty Correlation Chart
The statistical analysis conducted on geographies consisting of 321,816,529 people shows a substantial positive correlation between the proportion of Central American Indians and poverty level among single mothers in the United States with a correlation coefficient (R) of 0.529 and weighted average of 34.3%. Similarly, the statistical analysis conducted on geographies consisting of 262,198,183 people shows a poor negative correlation between the proportion of Serbians and poverty level among single mothers in the United States with a correlation coefficient (R) of -0.123 and weighted average of 28.6%, a difference of 20.2%.
Single Mother Poverty Correlation Summary
| Measurement | Central American Indian | Serbian |
| Minimum | 11.3% | 5.8% |
| Maximum | 100.0% | 76.1% |
| Range | 88.7% | 70.4% |
| Mean | 49.3% | 31.6% |
| Median | 44.9% | 29.6% |
| Interquartile 25% (IQ1) | 34.2% | 26.8% |
| Interquartile 75% (IQ3) | 62.6% | 35.8% |
| Interquartile Range (IQR) | 28.3% | 9.0% |
| Standard Deviation (Sample) | 22.0% | 17.4% |
| Standard Deviation (Population) | 21.8% | 17.1% |
Similar Demographics by Single Mother Poverty
Demographics Similar to Central American Indians by Single Mother Poverty
In terms of single mother poverty, the demographic groups most similar to Central American Indians are Alsatian (34.3%, a difference of 0.080%), Immigrants from Dominican Republic (34.4%, a difference of 0.080%), Chickasaw (34.4%, a difference of 0.26%), Hopi (34.5%, a difference of 0.34%), and Honduran (34.2%, a difference of 0.39%).
| Demographics | Rating | Rank | Single Mother Poverty |
| Immigrants | Central America | 0.0 /100 | #305 | Tragic 33.6% |
| Immigrants | Congo | 0.0 /100 | #306 | Tragic 33.8% |
| Comanche | 0.0 /100 | #307 | Tragic 33.9% |
| Immigrants | Mexico | 0.0 /100 | #308 | Tragic 34.0% |
| Potawatomi | 0.0 /100 | #309 | Tragic 34.1% |
| Hondurans | 0.0 /100 | #310 | Tragic 34.2% |
| Alsatians | 0.0 /100 | #311 | Tragic 34.3% |
| Central American Indians | 0.0 /100 | #312 | Tragic 34.3% |
| Immigrants | Dominican Republic | 0.0 /100 | #313 | Tragic 34.4% |
| Chickasaw | 0.0 /100 | #314 | Tragic 34.4% |
| Hopi | 0.0 /100 | #315 | Tragic 34.5% |
| Dominicans | 0.0 /100 | #316 | Tragic 34.5% |
| Cherokee | 0.0 /100 | #317 | Tragic 34.5% |
| Immigrants | Honduras | 0.0 /100 | #318 | Tragic 34.7% |
| Chippewa | 0.0 /100 | #319 | Tragic 34.8% |
Demographics Similar to Serbians by Single Mother Poverty
In terms of single mother poverty, the demographic groups most similar to Serbians are Syrian (28.6%, a difference of 0.020%), Immigrants from Lebanon (28.6%, a difference of 0.030%), Immigrants from Denmark (28.5%, a difference of 0.10%), Immigrants from South America (28.5%, a difference of 0.11%), and Luxembourger (28.5%, a difference of 0.14%).
| Demographics | Rating | Rank | Single Mother Poverty |
| South Africans | 86.6 /100 | #142 | Excellent 28.5% |
| Immigrants | North America | 86.5 /100 | #143 | Excellent 28.5% |
| Luxembourgers | 86.4 /100 | #144 | Excellent 28.5% |
| Immigrants | South America | 86.1 /100 | #145 | Excellent 28.5% |
| Immigrants | Denmark | 86.1 /100 | #146 | Excellent 28.5% |
| Immigrants | Lebanon | 85.3 /100 | #147 | Excellent 28.6% |
| Syrians | 85.3 /100 | #148 | Excellent 28.6% |
| Serbians | 85.0 /100 | #149 | Excellent 28.6% |
| Northern Europeans | 81.7 /100 | #150 | Excellent 28.6% |
| Immigrants | Oceania | 79.9 /100 | #151 | Good 28.7% |
| Austrians | 79.0 /100 | #152 | Good 28.7% |
| Slovenes | 76.4 /100 | #153 | Good 28.8% |
| Portuguese | 73.2 /100 | #154 | Good 28.8% |
| Ugandans | 71.7 /100 | #155 | Good 28.8% |
| Iraqis | 71.5 /100 | #156 | Good 28.8% |