Immigrants from Israel vs Serbian Unemployment Among Women with Children Ages 6 to 17 years
COMPARE
Immigrants from Israel
Serbian
Unemployment Among Women with Children Ages 6 to 17 years
Unemployment Among Women with Children Ages 6 to 17 years Comparison
Immigrants from Israel
Serbians
8.5%
UNEMPLOYMENT AMONG WOMEN WITH CHILDREN AGES 6 TO 17 YEARS
99.1/ 100
METRIC RATING
87th/ 347
METRIC RANK
8.8%
UNEMPLOYMENT AMONG WOMEN WITH CHILDREN AGES 6 TO 17 YEARS
87.6/ 100
METRIC RATING
141st/ 347
METRIC RANK
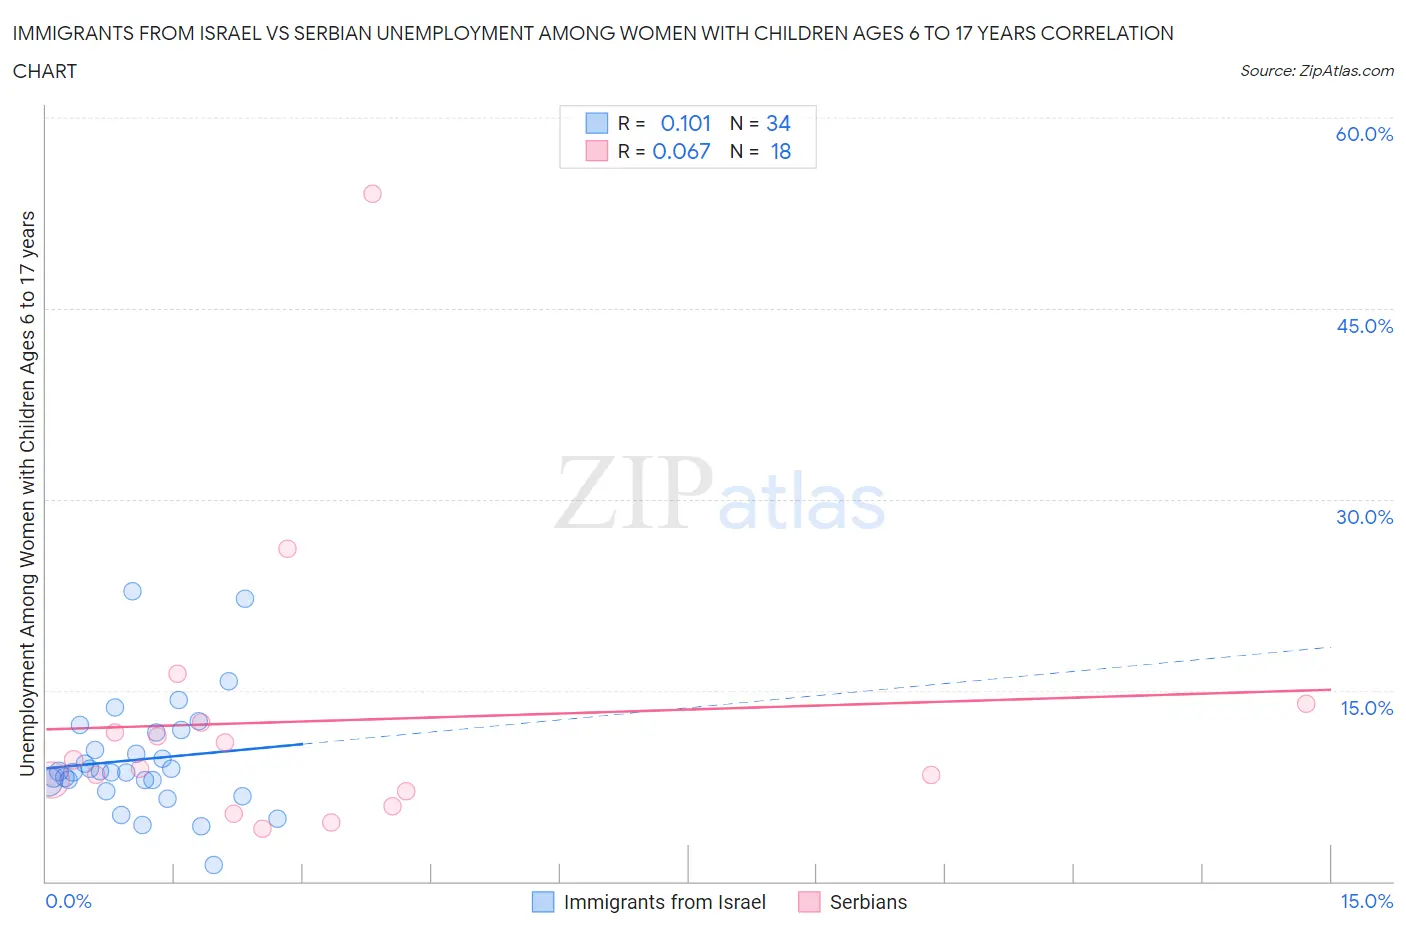
Immigrants from Israel vs Serbian Unemployment Among Women with Children Ages 6 to 17 years Correlation Chart
The statistical analysis conducted on geographies consisting of 166,050,756 people shows a poor positive correlation between the proportion of Immigrants from Israel and unemployment rate among women with children between the ages 6 and 17 in the United States with a correlation coefficient (R) of 0.101 and weighted average of 8.5%. Similarly, the statistical analysis conducted on geographies consisting of 199,468,329 people shows a slight positive correlation between the proportion of Serbians and unemployment rate among women with children between the ages 6 and 17 in the United States with a correlation coefficient (R) of 0.067 and weighted average of 8.8%, a difference of 3.3%.
Unemployment Among Women with Children Ages 6 to 17 years Correlation Summary
| Measurement | Immigrants from Israel | Serbian |
| Minimum | 1.3% | 4.2% |
| Maximum | 22.7% | 54.0% |
| Range | 21.4% | 49.8% |
| Mean | 9.6% | 12.6% |
| Median | 8.6% | 9.2% |
| Interquartile 25% (IQ1) | 7.8% | 7.1% |
| Interquartile 75% (IQ3) | 11.7% | 12.4% |
| Interquartile Range (IQR) | 3.9% | 5.3% |
| Standard Deviation (Sample) | 4.4% | 11.5% |
| Standard Deviation (Population) | 4.3% | 11.2% |
Similar Demographics by Unemployment Among Women with Children Ages 6 to 17 years
Demographics Similar to Immigrants from Israel by Unemployment Among Women with Children Ages 6 to 17 years
In terms of unemployment among women with children ages 6 to 17 years, the demographic groups most similar to Immigrants from Israel are Immigrants from Vietnam (8.5%, a difference of 0.020%), Paiute (8.5%, a difference of 0.10%), Yugoslavian (8.5%, a difference of 0.13%), Immigrants from Eastern Europe (8.5%, a difference of 0.20%), and Potawatomi (8.5%, a difference of 0.22%).
| Demographics | Rating | Rank | Unemployment Among Women with Children Ages 6 to 17 years |
| Immigrants | Belarus | 99.6 /100 | #80 | Exceptional 8.4% |
| Immigrants | Bolivia | 99.6 /100 | #81 | Exceptional 8.4% |
| Cypriots | 99.6 /100 | #82 | Exceptional 8.4% |
| Bulgarians | 99.5 /100 | #83 | Exceptional 8.4% |
| Japanese | 99.5 /100 | #84 | Exceptional 8.4% |
| Immigrants | North Macedonia | 99.4 /100 | #85 | Exceptional 8.5% |
| Alaskan Athabascans | 99.4 /100 | #86 | Exceptional 8.5% |
| Immigrants | Israel | 99.1 /100 | #87 | Exceptional 8.5% |
| Immigrants | Vietnam | 99.1 /100 | #88 | Exceptional 8.5% |
| Paiute | 99.1 /100 | #89 | Exceptional 8.5% |
| Yugoslavians | 99.0 /100 | #90 | Exceptional 8.5% |
| Immigrants | Eastern Europe | 99.0 /100 | #91 | Exceptional 8.5% |
| Potawatomi | 99.0 /100 | #92 | Exceptional 8.5% |
| Australians | 98.9 /100 | #93 | Exceptional 8.5% |
| Immigrants | Barbados | 98.8 /100 | #94 | Exceptional 8.5% |
Demographics Similar to Serbians by Unemployment Among Women with Children Ages 6 to 17 years
In terms of unemployment among women with children ages 6 to 17 years, the demographic groups most similar to Serbians are Immigrants from Austria (8.8%, a difference of 0.020%), Immigrants from Poland (8.8%, a difference of 0.070%), Immigrants from Kenya (8.8%, a difference of 0.15%), Northern European (8.8%, a difference of 0.18%), and Russian (8.8%, a difference of 0.18%).
| Demographics | Rating | Rank | Unemployment Among Women with Children Ages 6 to 17 years |
| Immigrants | Ireland | 91.0 /100 | #134 | Exceptional 8.7% |
| Europeans | 90.6 /100 | #135 | Exceptional 8.7% |
| Immigrants | Latvia | 90.4 /100 | #136 | Exceptional 8.7% |
| Immigrants | Argentina | 90.0 /100 | #137 | Excellent 8.7% |
| Immigrants | Ethiopia | 89.5 /100 | #138 | Excellent 8.8% |
| Northern Europeans | 89.2 /100 | #139 | Excellent 8.8% |
| Immigrants | Poland | 88.3 /100 | #140 | Excellent 8.8% |
| Serbians | 87.6 /100 | #141 | Excellent 8.8% |
| Immigrants | Austria | 87.5 /100 | #142 | Excellent 8.8% |
| Immigrants | Kenya | 86.1 /100 | #143 | Excellent 8.8% |
| Russians | 85.8 /100 | #144 | Excellent 8.8% |
| Kenyans | 85.6 /100 | #145 | Excellent 8.8% |
| Chileans | 80.8 /100 | #146 | Excellent 8.8% |
| Immigrants | Bangladesh | 79.4 /100 | #147 | Good 8.8% |
| Costa Ricans | 77.0 /100 | #148 | Good 8.8% |