Immigrants from Israel vs Potawatomi Single Male Poverty
COMPARE
Immigrants from Israel
Potawatomi
Single Male Poverty
Single Male Poverty Comparison
Immigrants from Israel
Potawatomi
12.1%
SINGLE MALE POVERTY
98.5/ 100
METRIC RATING
86th/ 347
METRIC RANK
15.8%
SINGLE MALE POVERTY
0.0/ 100
METRIC RATING
308th/ 347
METRIC RANK
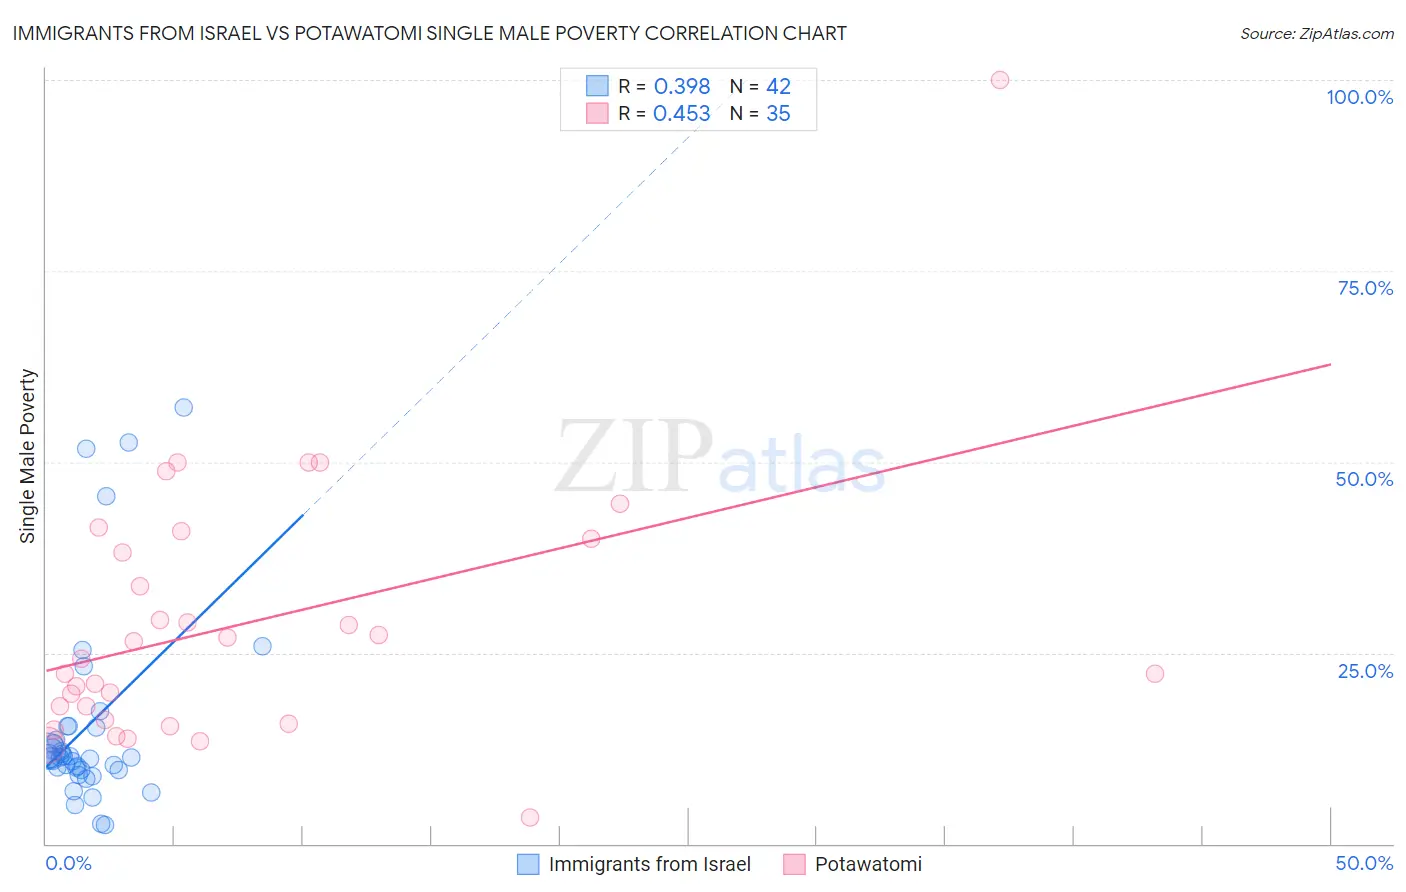
Immigrants from Israel vs Potawatomi Single Male Poverty Correlation Chart
The statistical analysis conducted on geographies consisting of 190,801,903 people shows a mild positive correlation between the proportion of Immigrants from Israel and poverty level among single males in the United States with a correlation coefficient (R) of 0.398 and weighted average of 12.1%. Similarly, the statistical analysis conducted on geographies consisting of 112,014,628 people shows a moderate positive correlation between the proportion of Potawatomi and poverty level among single males in the United States with a correlation coefficient (R) of 0.453 and weighted average of 15.8%, a difference of 30.4%.
Single Male Poverty Correlation Summary
| Measurement | Immigrants from Israel | Potawatomi |
| Minimum | 2.4% | 3.4% |
| Maximum | 57.1% | 100.0% |
| Range | 54.7% | 96.6% |
| Mean | 15.4% | 28.9% |
| Median | 11.3% | 24.3% |
| Interquartile 25% (IQ1) | 9.7% | 16.3% |
| Interquartile 75% (IQ3) | 15.3% | 40.0% |
| Interquartile Range (IQR) | 5.6% | 23.7% |
| Standard Deviation (Sample) | 12.9% | 17.6% |
| Standard Deviation (Population) | 12.8% | 17.3% |
Similar Demographics by Single Male Poverty
Demographics Similar to Immigrants from Israel by Single Male Poverty
In terms of single male poverty, the demographic groups most similar to Immigrants from Israel are South American (12.1%, a difference of 0.010%), Turkish (12.1%, a difference of 0.020%), Immigrants from Eritrea (12.1%, a difference of 0.020%), Immigrants from Czechoslovakia (12.1%, a difference of 0.090%), and Immigrants from Colombia (12.1%, a difference of 0.12%).
| Demographics | Rating | Rank | Single Male Poverty |
| Immigrants | Belgium | 99.0 /100 | #79 | Exceptional 12.0% |
| Armenians | 98.7 /100 | #80 | Exceptional 12.1% |
| Immigrants | South America | 98.7 /100 | #81 | Exceptional 12.1% |
| Immigrants | Colombia | 98.6 /100 | #82 | Exceptional 12.1% |
| Immigrants | Chile | 98.6 /100 | #83 | Exceptional 12.1% |
| Immigrants | Czechoslovakia | 98.6 /100 | #84 | Exceptional 12.1% |
| Turks | 98.5 /100 | #85 | Exceptional 12.1% |
| Immigrants | Israel | 98.5 /100 | #86 | Exceptional 12.1% |
| South Americans | 98.5 /100 | #87 | Exceptional 12.1% |
| Immigrants | Eritrea | 98.5 /100 | #88 | Exceptional 12.1% |
| Immigrants | Ireland | 98.3 /100 | #89 | Exceptional 12.1% |
| South American Indians | 98.3 /100 | #90 | Exceptional 12.1% |
| Immigrants | Turkey | 98.2 /100 | #91 | Exceptional 12.1% |
| Spanish American Indians | 98.0 /100 | #92 | Exceptional 12.1% |
| Immigrants | Bosnia and Herzegovina | 97.9 /100 | #93 | Exceptional 12.1% |
Demographics Similar to Potawatomi by Single Male Poverty
In terms of single male poverty, the demographic groups most similar to Potawatomi are American (15.8%, a difference of 0.17%), Ute (15.7%, a difference of 0.57%), Yakama (15.9%, a difference of 1.0%), Pennsylvania German (15.6%, a difference of 1.3%), and Seminole (16.0%, a difference of 1.6%).
| Demographics | Rating | Rank | Single Male Poverty |
| Dominicans | 0.0 /100 | #301 | Tragic 15.2% |
| Alsatians | 0.0 /100 | #302 | Tragic 15.2% |
| Aleuts | 0.0 /100 | #303 | Tragic 15.4% |
| Alaska Natives | 0.0 /100 | #304 | Tragic 15.4% |
| Blackfeet | 0.0 /100 | #305 | Tragic 15.5% |
| Pennsylvania Germans | 0.0 /100 | #306 | Tragic 15.6% |
| Ute | 0.0 /100 | #307 | Tragic 15.7% |
| Potawatomi | 0.0 /100 | #308 | Tragic 15.8% |
| Americans | 0.0 /100 | #309 | Tragic 15.8% |
| Yakama | 0.0 /100 | #310 | Tragic 15.9% |
| Seminole | 0.0 /100 | #311 | Tragic 16.0% |
| Comanche | 0.0 /100 | #312 | Tragic 16.0% |
| Cherokee | 0.0 /100 | #313 | Tragic 16.1% |
| Alaskan Athabascans | 0.0 /100 | #314 | Tragic 16.1% |
| Cheyenne | 0.0 /100 | #315 | Tragic 16.1% |