Immigrants from Lebanon vs Potawatomi Single Male Poverty
COMPARE
Immigrants from Lebanon
Potawatomi
Single Male Poverty
Single Male Poverty Comparison
Immigrants from Lebanon
Potawatomi
12.6%
SINGLE MALE POVERTY
75.0/ 100
METRIC RATING
145th/ 347
METRIC RANK
15.8%
SINGLE MALE POVERTY
0.0/ 100
METRIC RATING
308th/ 347
METRIC RANK
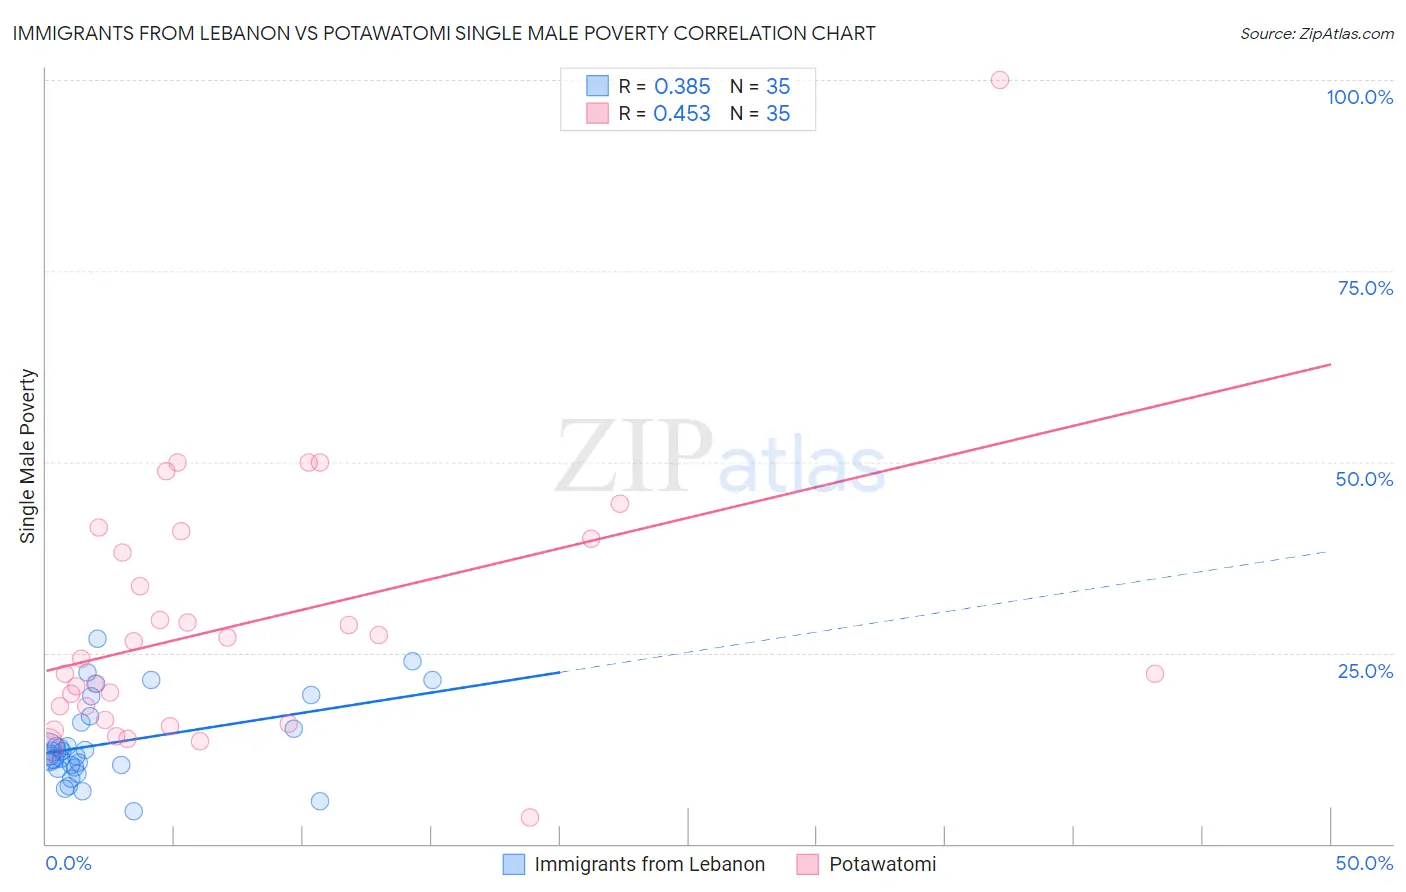
Immigrants from Lebanon vs Potawatomi Single Male Poverty Correlation Chart
The statistical analysis conducted on geographies consisting of 197,960,009 people shows a mild positive correlation between the proportion of Immigrants from Lebanon and poverty level among single males in the United States with a correlation coefficient (R) of 0.385 and weighted average of 12.6%. Similarly, the statistical analysis conducted on geographies consisting of 112,014,628 people shows a moderate positive correlation between the proportion of Potawatomi and poverty level among single males in the United States with a correlation coefficient (R) of 0.453 and weighted average of 15.8%, a difference of 25.0%.
Single Male Poverty Correlation Summary
| Measurement | Immigrants from Lebanon | Potawatomi |
| Minimum | 4.3% | 3.4% |
| Maximum | 26.9% | 100.0% |
| Range | 22.5% | 96.6% |
| Mean | 13.3% | 28.9% |
| Median | 12.1% | 24.3% |
| Interquartile 25% (IQ1) | 10.0% | 16.3% |
| Interquartile 75% (IQ3) | 16.6% | 40.0% |
| Interquartile Range (IQR) | 6.7% | 23.7% |
| Standard Deviation (Sample) | 5.5% | 17.6% |
| Standard Deviation (Population) | 5.4% | 17.3% |
Similar Demographics by Single Male Poverty
Demographics Similar to Immigrants from Lebanon by Single Male Poverty
In terms of single male poverty, the demographic groups most similar to Immigrants from Lebanon are Native Hawaiian (12.6%, a difference of 0.0%), Hawaiian (12.6%, a difference of 0.010%), Malaysian (12.6%, a difference of 0.010%), Immigrants from France (12.6%, a difference of 0.060%), and Okinawan (12.6%, a difference of 0.070%).
| Demographics | Rating | Rank | Single Male Poverty |
| Immigrants | El Salvador | 80.0 /100 | #138 | Excellent 12.6% |
| Cubans | 79.9 /100 | #139 | Good 12.6% |
| Immigrants | Zimbabwe | 78.0 /100 | #140 | Good 12.6% |
| Okinawans | 75.9 /100 | #141 | Good 12.6% |
| Immigrants | Uganda | 75.9 /100 | #142 | Good 12.6% |
| Immigrants | France | 75.8 /100 | #143 | Good 12.6% |
| Hawaiians | 75.1 /100 | #144 | Good 12.6% |
| Immigrants | Lebanon | 75.0 /100 | #145 | Good 12.6% |
| Native Hawaiians | 75.0 /100 | #146 | Good 12.6% |
| Malaysians | 74.8 /100 | #147 | Good 12.6% |
| Yugoslavians | 73.9 /100 | #148 | Good 12.6% |
| Sierra Leoneans | 73.0 /100 | #149 | Good 12.6% |
| Immigrants | Panama | 72.1 /100 | #150 | Good 12.6% |
| Immigrants | Hungary | 71.9 /100 | #151 | Good 12.6% |
| Australians | 71.4 /100 | #152 | Good 12.6% |
Demographics Similar to Potawatomi by Single Male Poverty
In terms of single male poverty, the demographic groups most similar to Potawatomi are American (15.8%, a difference of 0.17%), Ute (15.7%, a difference of 0.57%), Yakama (15.9%, a difference of 1.0%), Pennsylvania German (15.6%, a difference of 1.3%), and Seminole (16.0%, a difference of 1.6%).
| Demographics | Rating | Rank | Single Male Poverty |
| Dominicans | 0.0 /100 | #301 | Tragic 15.2% |
| Alsatians | 0.0 /100 | #302 | Tragic 15.2% |
| Aleuts | 0.0 /100 | #303 | Tragic 15.4% |
| Alaska Natives | 0.0 /100 | #304 | Tragic 15.4% |
| Blackfeet | 0.0 /100 | #305 | Tragic 15.5% |
| Pennsylvania Germans | 0.0 /100 | #306 | Tragic 15.6% |
| Ute | 0.0 /100 | #307 | Tragic 15.7% |
| Potawatomi | 0.0 /100 | #308 | Tragic 15.8% |
| Americans | 0.0 /100 | #309 | Tragic 15.8% |
| Yakama | 0.0 /100 | #310 | Tragic 15.9% |
| Seminole | 0.0 /100 | #311 | Tragic 16.0% |
| Comanche | 0.0 /100 | #312 | Tragic 16.0% |
| Cherokee | 0.0 /100 | #313 | Tragic 16.1% |
| Alaskan Athabascans | 0.0 /100 | #314 | Tragic 16.1% |
| Cheyenne | 0.0 /100 | #315 | Tragic 16.1% |