Immigrants from Israel vs Immigrants from Hong Kong High School Diploma
COMPARE
Immigrants from Israel
Immigrants from Hong Kong
High School Diploma
High School Diploma Comparison
Immigrants from Israel
Immigrants from Hong Kong
90.5%
HIGH SCHOOL DIPLOMA
98.5/ 100
METRIC RATING
94th/ 347
METRIC RANK
89.3%
HIGH SCHOOL DIPLOMA
58.6/ 100
METRIC RATING
167th/ 347
METRIC RANK
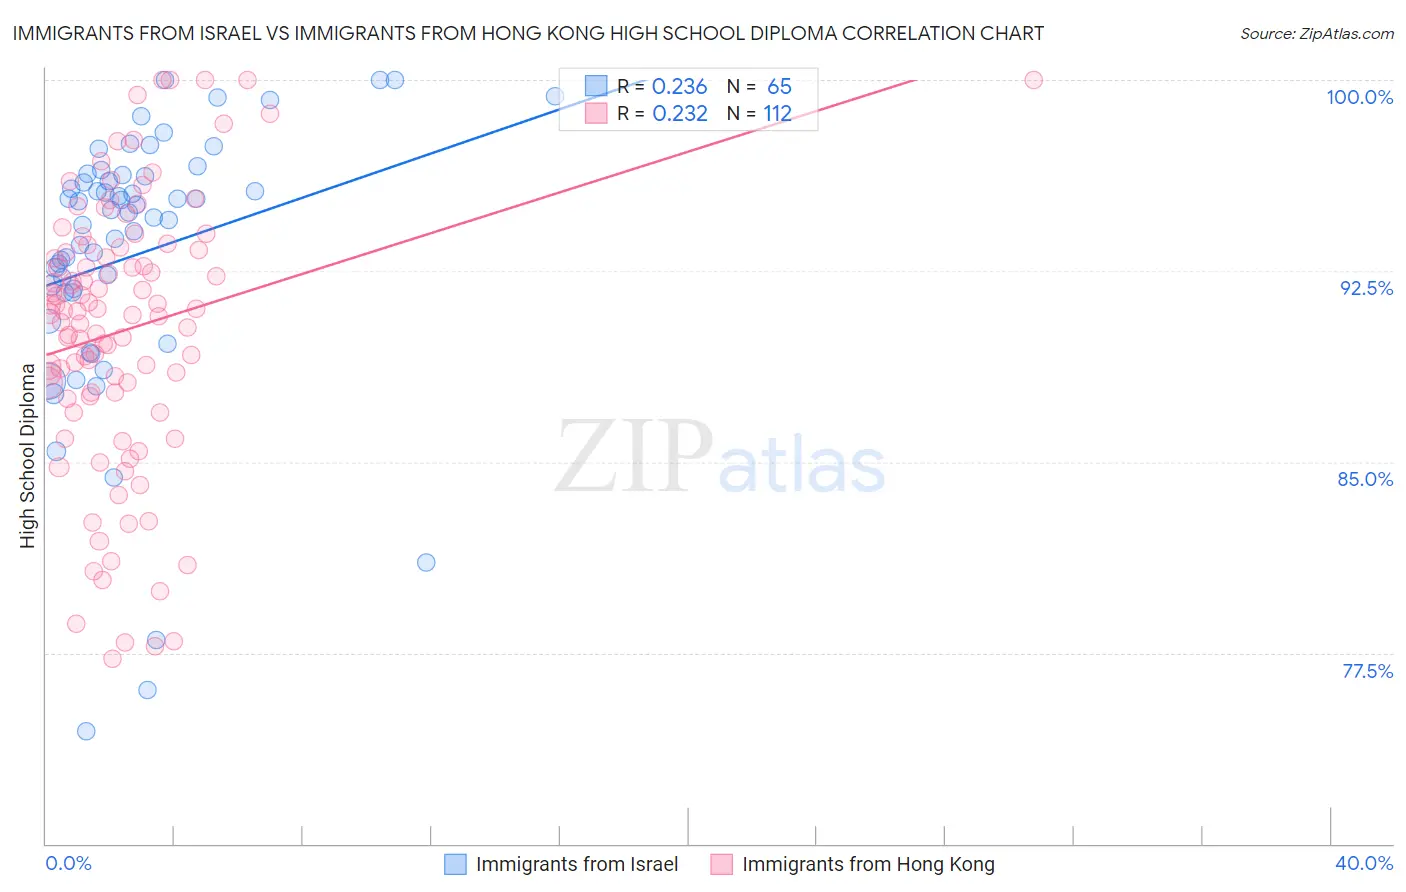
Immigrants from Israel vs Immigrants from Hong Kong High School Diploma Correlation Chart
The statistical analysis conducted on geographies consisting of 210,029,020 people shows a weak positive correlation between the proportion of Immigrants from Israel and percentage of population with at least high school diploma education in the United States with a correlation coefficient (R) of 0.236 and weighted average of 90.5%. Similarly, the statistical analysis conducted on geographies consisting of 253,990,250 people shows a weak positive correlation between the proportion of Immigrants from Hong Kong and percentage of population with at least high school diploma education in the United States with a correlation coefficient (R) of 0.232 and weighted average of 89.3%, a difference of 1.4%.
High School Diploma Correlation Summary
| Measurement | Immigrants from Israel | Immigrants from Hong Kong |
| Minimum | 74.4% | 77.3% |
| Maximum | 100.0% | 100.0% |
| Range | 25.6% | 22.7% |
| Mean | 93.1% | 90.2% |
| Median | 94.8% | 90.9% |
| Interquartile 25% (IQ1) | 91.7% | 87.7% |
| Interquartile 75% (IQ3) | 96.2% | 93.4% |
| Interquartile Range (IQR) | 4.6% | 5.7% |
| Standard Deviation (Sample) | 5.4% | 5.3% |
| Standard Deviation (Population) | 5.4% | 5.3% |
Similar Demographics by High School Diploma
Demographics Similar to Immigrants from Israel by High School Diploma
In terms of high school diploma, the demographic groups most similar to Immigrants from Israel are Icelander (90.5%, a difference of 0.0%), Immigrants from Serbia (90.5%, a difference of 0.010%), Swiss (90.6%, a difference of 0.020%), Immigrants from Western Europe (90.6%, a difference of 0.020%), and South African (90.6%, a difference of 0.040%).
| Demographics | Rating | Rank | High School Diploma |
| Immigrants | Turkey | 98.9 /100 | #87 | Exceptional 90.6% |
| Immigrants | France | 98.8 /100 | #88 | Exceptional 90.6% |
| Canadians | 98.7 /100 | #89 | Exceptional 90.6% |
| Celtics | 98.7 /100 | #90 | Exceptional 90.6% |
| South Africans | 98.6 /100 | #91 | Exceptional 90.6% |
| Swiss | 98.6 /100 | #92 | Exceptional 90.6% |
| Immigrants | Western Europe | 98.6 /100 | #93 | Exceptional 90.6% |
| Immigrants | Israel | 98.5 /100 | #94 | Exceptional 90.5% |
| Icelanders | 98.5 /100 | #95 | Exceptional 90.5% |
| Immigrants | Serbia | 98.4 /100 | #96 | Exceptional 90.5% |
| Immigrants | Kuwait | 98.3 /100 | #97 | Exceptional 90.5% |
| Immigrants | Korea | 98.3 /100 | #98 | Exceptional 90.5% |
| Immigrants | Europe | 98.2 /100 | #99 | Exceptional 90.5% |
| Immigrants | North Macedonia | 98.1 /100 | #100 | Exceptional 90.5% |
| Immigrants | Norway | 98.0 /100 | #101 | Exceptional 90.5% |
Demographics Similar to Immigrants from Hong Kong by High School Diploma
In terms of high school diploma, the demographic groups most similar to Immigrants from Hong Kong are Immigrants from Albania (89.3%, a difference of 0.010%), Immigrants from Asia (89.3%, a difference of 0.020%), Brazilian (89.3%, a difference of 0.040%), Bermudan (89.3%, a difference of 0.040%), and Cree (89.3%, a difference of 0.040%).
| Demographics | Rating | Rank | High School Diploma |
| Laotians | 61.8 /100 | #160 | Good 89.3% |
| Brazilians | 61.2 /100 | #161 | Good 89.3% |
| Bermudans | 61.1 /100 | #162 | Good 89.3% |
| Cree | 61.1 /100 | #163 | Good 89.3% |
| Immigrants | Nepal | 61.1 /100 | #164 | Good 89.3% |
| Immigrants | Asia | 59.8 /100 | #165 | Average 89.3% |
| Immigrants | Albania | 59.4 /100 | #166 | Average 89.3% |
| Immigrants | Hong Kong | 58.6 /100 | #167 | Average 89.3% |
| Delaware | 55.8 /100 | #168 | Average 89.2% |
| Iroquois | 55.1 /100 | #169 | Average 89.2% |
| Immigrants | Morocco | 53.3 /100 | #170 | Average 89.2% |
| Spanish | 52.9 /100 | #171 | Average 89.2% |
| Immigrants | Nonimmigrants | 51.8 /100 | #172 | Average 89.2% |
| Immigrants | Indonesia | 50.3 /100 | #173 | Average 89.1% |
| Hmong | 50.0 /100 | #174 | Average 89.1% |