Immigrants from Israel vs Icelander Family Poverty
COMPARE
Immigrants from Israel
Icelander
Family Poverty
Family Poverty Comparison
Immigrants from Israel
Icelanders
8.2%
FAMILY POVERTY
93.5/ 100
METRIC RATING
115th/ 347
METRIC RANK
8.3%
FAMILY POVERTY
90.3/ 100
METRIC RATING
126th/ 347
METRIC RANK
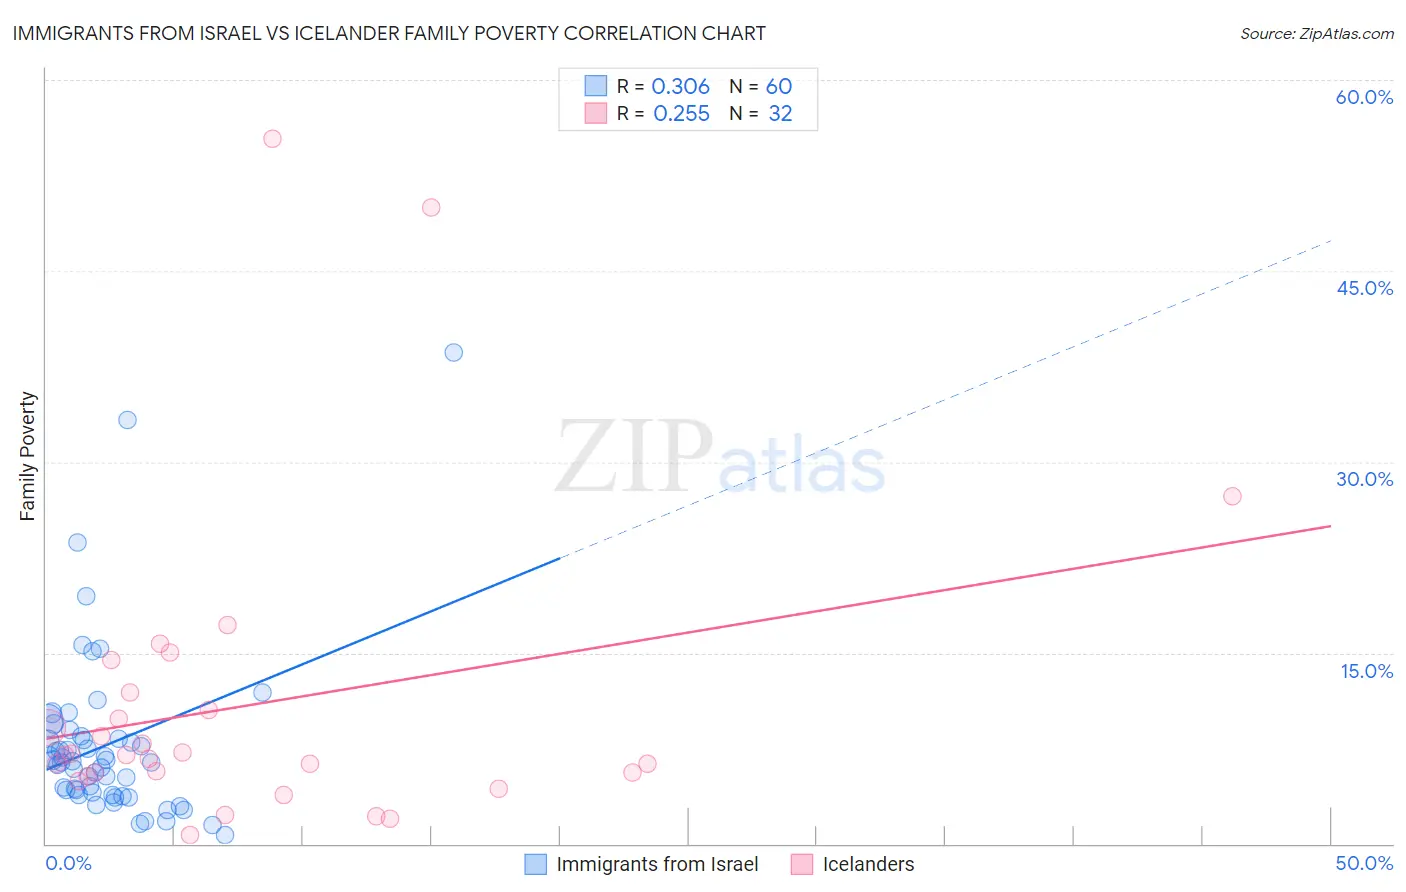
Immigrants from Israel vs Icelander Family Poverty Correlation Chart
The statistical analysis conducted on geographies consisting of 209,738,348 people shows a mild positive correlation between the proportion of Immigrants from Israel and poverty level among families in the United States with a correlation coefficient (R) of 0.306 and weighted average of 8.2%. Similarly, the statistical analysis conducted on geographies consisting of 159,459,929 people shows a weak positive correlation between the proportion of Icelanders and poverty level among families in the United States with a correlation coefficient (R) of 0.255 and weighted average of 8.3%, a difference of 1.5%.
Family Poverty Correlation Summary
| Measurement | Immigrants from Israel | Icelander |
| Minimum | 0.67% | 0.72% |
| Maximum | 38.6% | 55.4% |
| Range | 37.9% | 54.6% |
| Mean | 7.8% | 10.9% |
| Median | 6.5% | 7.0% |
| Interquartile 25% (IQ1) | 4.0% | 5.4% |
| Interquartile 75% (IQ3) | 8.3% | 11.2% |
| Interquartile Range (IQR) | 4.4% | 5.7% |
| Standard Deviation (Sample) | 6.8% | 12.2% |
| Standard Deviation (Population) | 6.7% | 12.0% |
Demographics Similar to Immigrants from Israel and Icelanders by Family Poverty
In terms of family poverty, the demographic groups most similar to Immigrants from Israel are South African (8.2%, a difference of 0.060%), Immigrants from Russia (8.2%, a difference of 0.13%), Immigrants from Western Europe (8.2%, a difference of 0.32%), Immigrants from Zimbabwe (8.2%, a difference of 0.34%), and French (8.3%, a difference of 0.39%). Similarly, the demographic groups most similar to Icelanders are Immigrants from Hungary (8.4%, a difference of 0.13%), Pakistani (8.3%, a difference of 0.20%), Soviet Union (8.3%, a difference of 0.24%), Argentinean (8.4%, a difference of 0.27%), and Palestinian (8.3%, a difference of 0.34%).
| Demographics | Rating | Rank | Family Poverty |
| Romanians | 94.7 /100 | #110 | Exceptional 8.2% |
| Taiwanese | 94.6 /100 | #111 | Exceptional 8.2% |
| Immigrants | France | 94.4 /100 | #112 | Exceptional 8.2% |
| Canadians | 94.2 /100 | #113 | Exceptional 8.2% |
| Immigrants | Zimbabwe | 94.0 /100 | #114 | Exceptional 8.2% |
| Immigrants | Israel | 93.5 /100 | #115 | Exceptional 8.2% |
| South Africans | 93.4 /100 | #116 | Exceptional 8.2% |
| Immigrants | Russia | 93.2 /100 | #117 | Exceptional 8.2% |
| Immigrants | Western Europe | 92.9 /100 | #118 | Exceptional 8.2% |
| French | 92.8 /100 | #119 | Exceptional 8.3% |
| Immigrants | Egypt | 91.6 /100 | #120 | Exceptional 8.3% |
| Native Hawaiians | 91.3 /100 | #121 | Exceptional 8.3% |
| Paraguayans | 91.2 /100 | #122 | Exceptional 8.3% |
| Palestinians | 91.1 /100 | #123 | Exceptional 8.3% |
| Soviet Union | 90.8 /100 | #124 | Exceptional 8.3% |
| Pakistanis | 90.8 /100 | #125 | Exceptional 8.3% |
| Icelanders | 90.3 /100 | #126 | Exceptional 8.3% |
| Immigrants | Hungary | 89.9 /100 | #127 | Excellent 8.4% |
| Argentineans | 89.6 /100 | #128 | Excellent 8.4% |
| Portuguese | 89.2 /100 | #129 | Excellent 8.4% |
| Immigrants | Bosnia and Herzegovina | 88.6 /100 | #130 | Excellent 8.4% |