Immigrants from Albania vs Icelander Family Poverty
COMPARE
Immigrants from Albania
Icelander
Family Poverty
Family Poverty Comparison
Immigrants from Albania
Icelanders
9.0%
FAMILY POVERTY
50.0/ 100
METRIC RATING
174th/ 347
METRIC RANK
8.3%
FAMILY POVERTY
90.3/ 100
METRIC RATING
126th/ 347
METRIC RANK
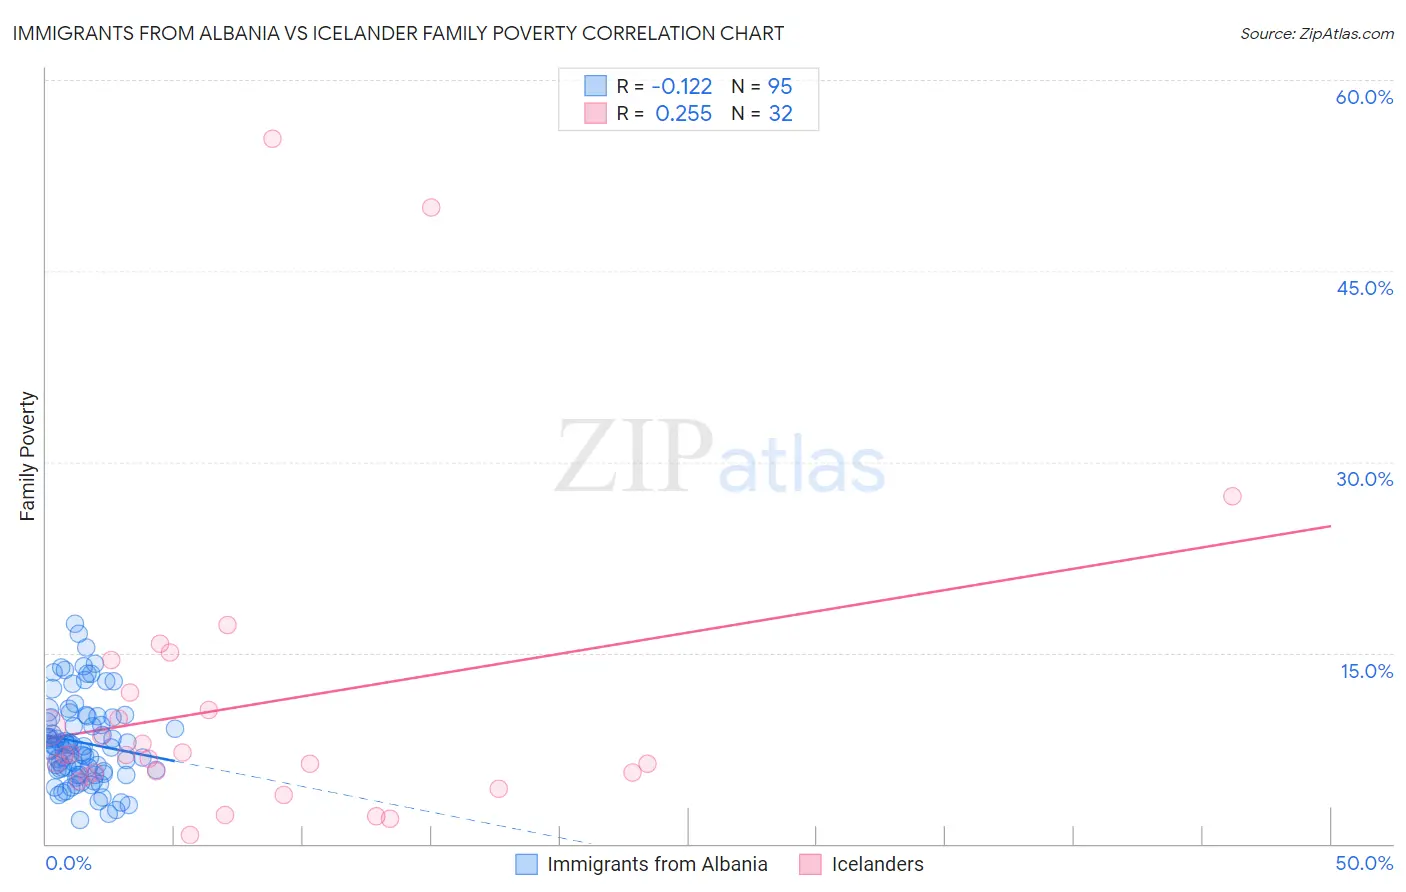
Immigrants from Albania vs Icelander Family Poverty Correlation Chart
The statistical analysis conducted on geographies consisting of 119,258,186 people shows a poor negative correlation between the proportion of Immigrants from Albania and poverty level among families in the United States with a correlation coefficient (R) of -0.122 and weighted average of 9.0%. Similarly, the statistical analysis conducted on geographies consisting of 159,459,929 people shows a weak positive correlation between the proportion of Icelanders and poverty level among families in the United States with a correlation coefficient (R) of 0.255 and weighted average of 8.3%, a difference of 7.9%.
Family Poverty Correlation Summary
| Measurement | Immigrants from Albania | Icelander |
| Minimum | 1.8% | 0.72% |
| Maximum | 17.3% | 55.4% |
| Range | 15.5% | 54.6% |
| Mean | 7.9% | 10.9% |
| Median | 7.5% | 7.0% |
| Interquartile 25% (IQ1) | 5.7% | 5.4% |
| Interquartile 75% (IQ3) | 10.0% | 11.2% |
| Interquartile Range (IQR) | 4.2% | 5.7% |
| Standard Deviation (Sample) | 3.3% | 12.2% |
| Standard Deviation (Population) | 3.3% | 12.0% |
Similar Demographics by Family Poverty
Demographics Similar to Immigrants from Albania by Family Poverty
In terms of family poverty, the demographic groups most similar to Immigrants from Albania are Costa Rican (9.0%, a difference of 0.090%), Immigrants from Syria (9.0%, a difference of 0.33%), Hawaiian (9.0%, a difference of 0.36%), Immigrants from Cameroon (9.0%, a difference of 0.37%), and Immigrants from Iraq (9.1%, a difference of 0.74%).
| Demographics | Rating | Rank | Family Poverty |
| Immigrants | Ethiopia | 62.5 /100 | #167 | Good 8.9% |
| Israelis | 62.1 /100 | #168 | Good 8.9% |
| Immigrants | Chile | 59.6 /100 | #169 | Average 8.9% |
| Kenyans | 58.2 /100 | #170 | Average 8.9% |
| Lebanese | 57.6 /100 | #171 | Average 8.9% |
| Immigrants | Peru | 57.5 /100 | #172 | Average 8.9% |
| Immigrants | Fiji | 56.4 /100 | #173 | Average 8.9% |
| Immigrants | Albania | 50.0 /100 | #174 | Average 9.0% |
| Costa Ricans | 49.3 /100 | #175 | Average 9.0% |
| Immigrants | Syria | 47.5 /100 | #176 | Average 9.0% |
| Hawaiians | 47.2 /100 | #177 | Average 9.0% |
| Immigrants | Cameroon | 47.1 /100 | #178 | Average 9.0% |
| Immigrants | Iraq | 44.4 /100 | #179 | Average 9.1% |
| Immigrants | Uganda | 43.4 /100 | #180 | Average 9.1% |
| Hmong | 40.2 /100 | #181 | Average 9.1% |
Demographics Similar to Icelanders by Family Poverty
In terms of family poverty, the demographic groups most similar to Icelanders are Immigrants from Hungary (8.4%, a difference of 0.13%), Pakistani (8.3%, a difference of 0.20%), Soviet Union (8.3%, a difference of 0.24%), Argentinean (8.4%, a difference of 0.27%), and Palestinian (8.3%, a difference of 0.34%).
| Demographics | Rating | Rank | Family Poverty |
| French | 92.8 /100 | #119 | Exceptional 8.3% |
| Immigrants | Egypt | 91.6 /100 | #120 | Exceptional 8.3% |
| Native Hawaiians | 91.3 /100 | #121 | Exceptional 8.3% |
| Paraguayans | 91.2 /100 | #122 | Exceptional 8.3% |
| Palestinians | 91.1 /100 | #123 | Exceptional 8.3% |
| Soviet Union | 90.8 /100 | #124 | Exceptional 8.3% |
| Pakistanis | 90.8 /100 | #125 | Exceptional 8.3% |
| Icelanders | 90.3 /100 | #126 | Exceptional 8.3% |
| Immigrants | Hungary | 89.9 /100 | #127 | Excellent 8.4% |
| Argentineans | 89.6 /100 | #128 | Excellent 8.4% |
| Portuguese | 89.2 /100 | #129 | Excellent 8.4% |
| Immigrants | Bosnia and Herzegovina | 88.6 /100 | #130 | Excellent 8.4% |
| Puget Sound Salish | 88.6 /100 | #131 | Excellent 8.4% |
| Immigrants | Argentina | 88.2 /100 | #132 | Excellent 8.4% |
| Sri Lankans | 86.6 /100 | #133 | Excellent 8.5% |