Immigrants from Yemen vs Icelander Family Poverty
COMPARE
Immigrants from Yemen
Icelander
Family Poverty
Family Poverty Comparison
Immigrants from Yemen
Icelanders
17.5%
FAMILY POVERTY
0.0/ 100
METRIC RATING
342nd/ 347
METRIC RANK
8.3%
FAMILY POVERTY
90.3/ 100
METRIC RATING
126th/ 347
METRIC RANK
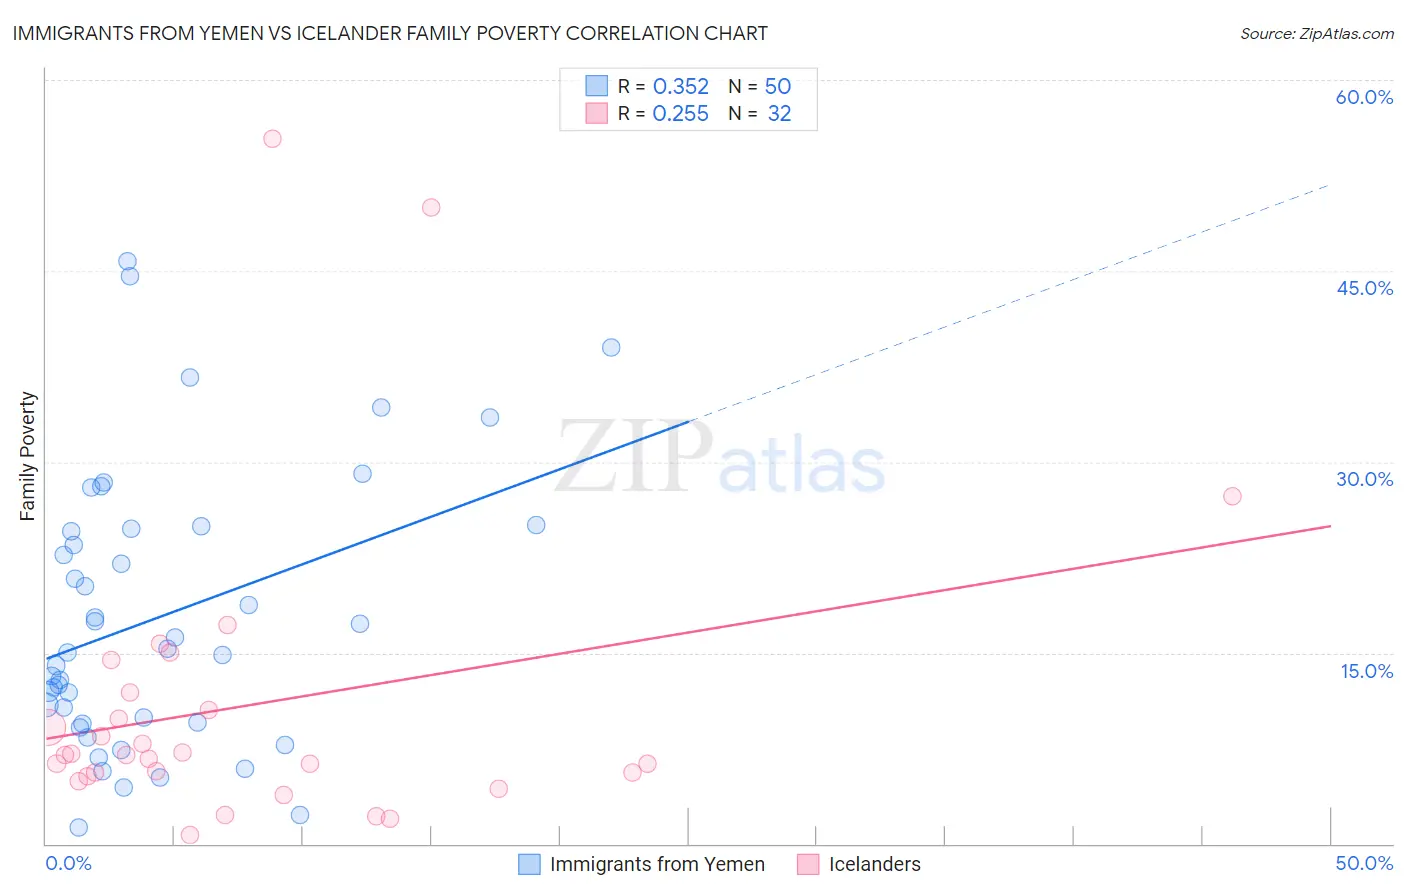
Immigrants from Yemen vs Icelander Family Poverty Correlation Chart
The statistical analysis conducted on geographies consisting of 82,405,331 people shows a mild positive correlation between the proportion of Immigrants from Yemen and poverty level among families in the United States with a correlation coefficient (R) of 0.352 and weighted average of 17.5%. Similarly, the statistical analysis conducted on geographies consisting of 159,459,929 people shows a weak positive correlation between the proportion of Icelanders and poverty level among families in the United States with a correlation coefficient (R) of 0.255 and weighted average of 8.3%, a difference of 109.2%.
Family Poverty Correlation Summary
| Measurement | Immigrants from Yemen | Icelander |
| Minimum | 1.2% | 0.72% |
| Maximum | 45.8% | 55.4% |
| Range | 44.6% | 54.6% |
| Mean | 17.8% | 10.9% |
| Median | 15.2% | 7.0% |
| Interquartile 25% (IQ1) | 9.5% | 5.4% |
| Interquartile 75% (IQ3) | 24.7% | 11.2% |
| Interquartile Range (IQR) | 15.2% | 5.7% |
| Standard Deviation (Sample) | 10.8% | 12.2% |
| Standard Deviation (Population) | 10.7% | 12.0% |
Similar Demographics by Family Poverty
Demographics Similar to Immigrants from Yemen by Family Poverty
In terms of family poverty, the demographic groups most similar to Immigrants from Yemen are Lumbee (17.0%, a difference of 2.8%), Pueblo (17.0%, a difference of 2.8%), Yuman (16.6%, a difference of 5.0%), Pima (18.4%, a difference of 5.1%), and Yup'ik (18.7%, a difference of 7.1%).
| Demographics | Rating | Rank | Family Poverty |
| Immigrants | Dominican Republic | 0.0 /100 | #333 | Tragic 14.4% |
| Houma | 0.0 /100 | #334 | Tragic 14.6% |
| Apache | 0.0 /100 | #335 | Tragic 14.7% |
| Sioux | 0.0 /100 | #336 | Tragic 15.9% |
| Hopi | 0.0 /100 | #337 | Tragic 15.9% |
| Crow | 0.0 /100 | #338 | Tragic 16.1% |
| Yuman | 0.0 /100 | #339 | Tragic 16.6% |
| Pueblo | 0.0 /100 | #340 | Tragic 17.0% |
| Lumbee | 0.0 /100 | #341 | Tragic 17.0% |
| Immigrants | Yemen | 0.0 /100 | #342 | Tragic 17.5% |
| Pima | 0.0 /100 | #343 | Tragic 18.4% |
| Yup'ik | 0.0 /100 | #344 | Tragic 18.7% |
| Navajo | 0.0 /100 | #345 | Tragic 18.8% |
| Puerto Ricans | 0.0 /100 | #346 | Tragic 20.3% |
| Tohono O'odham | 0.0 /100 | #347 | Tragic 20.4% |
Demographics Similar to Icelanders by Family Poverty
In terms of family poverty, the demographic groups most similar to Icelanders are Immigrants from Hungary (8.4%, a difference of 0.13%), Pakistani (8.3%, a difference of 0.20%), Soviet Union (8.3%, a difference of 0.24%), Argentinean (8.4%, a difference of 0.27%), and Palestinian (8.3%, a difference of 0.34%).
| Demographics | Rating | Rank | Family Poverty |
| French | 92.8 /100 | #119 | Exceptional 8.3% |
| Immigrants | Egypt | 91.6 /100 | #120 | Exceptional 8.3% |
| Native Hawaiians | 91.3 /100 | #121 | Exceptional 8.3% |
| Paraguayans | 91.2 /100 | #122 | Exceptional 8.3% |
| Palestinians | 91.1 /100 | #123 | Exceptional 8.3% |
| Soviet Union | 90.8 /100 | #124 | Exceptional 8.3% |
| Pakistanis | 90.8 /100 | #125 | Exceptional 8.3% |
| Icelanders | 90.3 /100 | #126 | Exceptional 8.3% |
| Immigrants | Hungary | 89.9 /100 | #127 | Excellent 8.4% |
| Argentineans | 89.6 /100 | #128 | Excellent 8.4% |
| Portuguese | 89.2 /100 | #129 | Excellent 8.4% |
| Immigrants | Bosnia and Herzegovina | 88.6 /100 | #130 | Excellent 8.4% |
| Puget Sound Salish | 88.6 /100 | #131 | Excellent 8.4% |
| Immigrants | Argentina | 88.2 /100 | #132 | Excellent 8.4% |
| Sri Lankans | 86.6 /100 | #133 | Excellent 8.5% |