Immigrants from Israel vs Guatemalan Family Poverty
COMPARE
Immigrants from Israel
Guatemalan
Family Poverty
Family Poverty Comparison
Immigrants from Israel
Guatemalans
8.2%
FAMILY POVERTY
93.5/ 100
METRIC RATING
115th/ 347
METRIC RANK
11.7%
FAMILY POVERTY
0.0/ 100
METRIC RATING
302nd/ 347
METRIC RANK
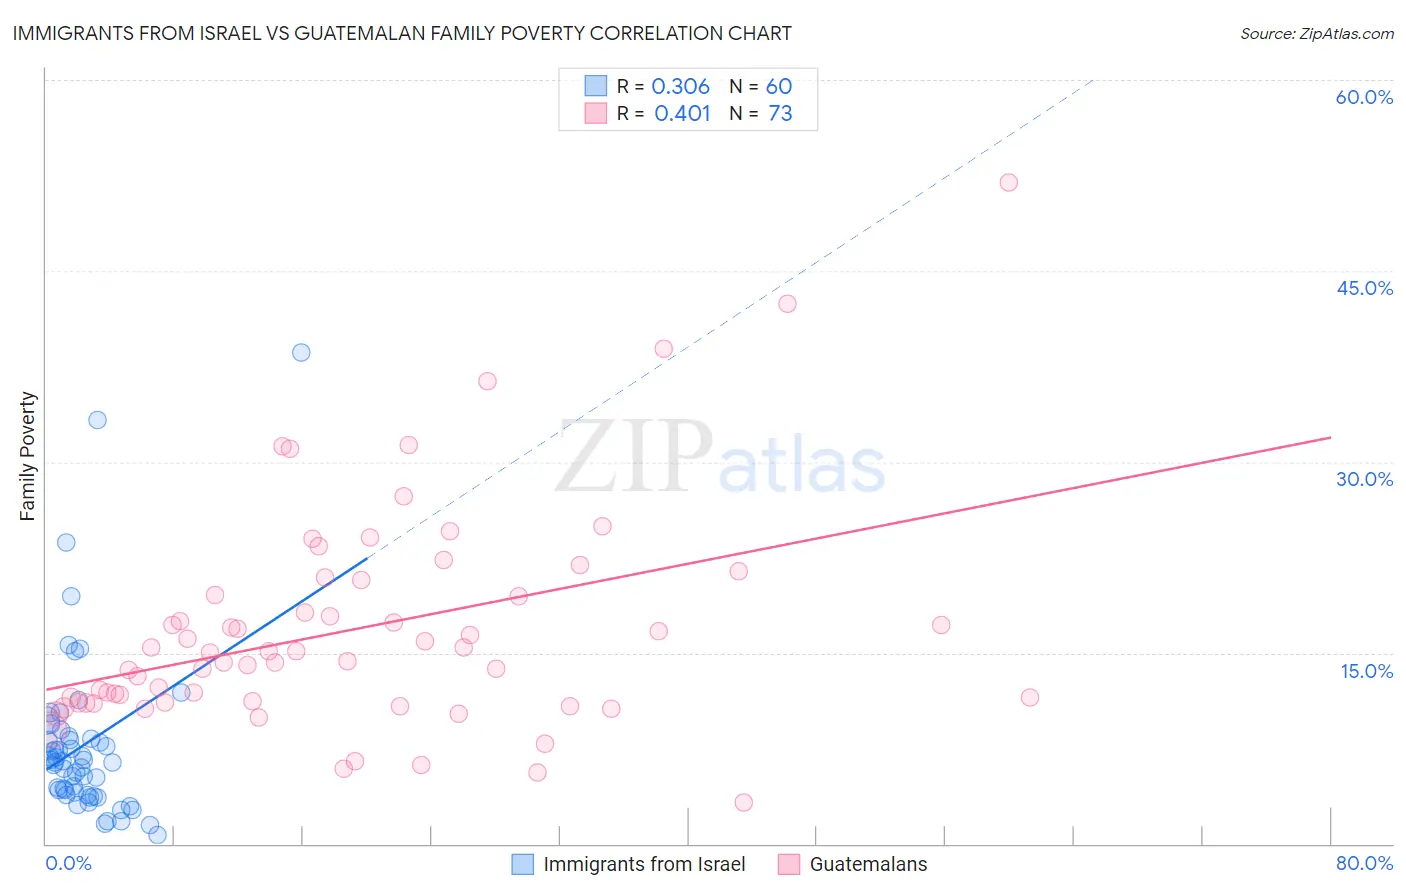
Immigrants from Israel vs Guatemalan Family Poverty Correlation Chart
The statistical analysis conducted on geographies consisting of 209,738,348 people shows a mild positive correlation between the proportion of Immigrants from Israel and poverty level among families in the United States with a correlation coefficient (R) of 0.306 and weighted average of 8.2%. Similarly, the statistical analysis conducted on geographies consisting of 408,686,067 people shows a moderate positive correlation between the proportion of Guatemalans and poverty level among families in the United States with a correlation coefficient (R) of 0.401 and weighted average of 11.7%, a difference of 42.5%.
Family Poverty Correlation Summary
| Measurement | Immigrants from Israel | Guatemalan |
| Minimum | 0.67% | 3.3% |
| Maximum | 38.6% | 51.9% |
| Range | 37.9% | 48.7% |
| Mean | 7.8% | 16.8% |
| Median | 6.5% | 15.0% |
| Interquartile 25% (IQ1) | 4.0% | 11.1% |
| Interquartile 75% (IQ3) | 8.3% | 20.1% |
| Interquartile Range (IQR) | 4.4% | 9.0% |
| Standard Deviation (Sample) | 6.8% | 8.7% |
| Standard Deviation (Population) | 6.7% | 8.6% |
Similar Demographics by Family Poverty
Demographics Similar to Immigrants from Israel by Family Poverty
In terms of family poverty, the demographic groups most similar to Immigrants from Israel are South African (8.2%, a difference of 0.060%), Immigrants from Russia (8.2%, a difference of 0.13%), Immigrants from Western Europe (8.2%, a difference of 0.32%), Immigrants from Zimbabwe (8.2%, a difference of 0.34%), and French (8.3%, a difference of 0.39%).
| Demographics | Rating | Rank | Family Poverty |
| Basques | 94.9 /100 | #108 | Exceptional 8.1% |
| Jordanians | 94.8 /100 | #109 | Exceptional 8.2% |
| Romanians | 94.7 /100 | #110 | Exceptional 8.2% |
| Taiwanese | 94.6 /100 | #111 | Exceptional 8.2% |
| Immigrants | France | 94.4 /100 | #112 | Exceptional 8.2% |
| Canadians | 94.2 /100 | #113 | Exceptional 8.2% |
| Immigrants | Zimbabwe | 94.0 /100 | #114 | Exceptional 8.2% |
| Immigrants | Israel | 93.5 /100 | #115 | Exceptional 8.2% |
| South Africans | 93.4 /100 | #116 | Exceptional 8.2% |
| Immigrants | Russia | 93.2 /100 | #117 | Exceptional 8.2% |
| Immigrants | Western Europe | 92.9 /100 | #118 | Exceptional 8.2% |
| French | 92.8 /100 | #119 | Exceptional 8.3% |
| Immigrants | Egypt | 91.6 /100 | #120 | Exceptional 8.3% |
| Native Hawaiians | 91.3 /100 | #121 | Exceptional 8.3% |
| Paraguayans | 91.2 /100 | #122 | Exceptional 8.3% |
Demographics Similar to Guatemalans by Family Poverty
In terms of family poverty, the demographic groups most similar to Guatemalans are Bahamian (11.7%, a difference of 0.040%), Immigrants from Bangladesh (11.7%, a difference of 0.29%), Dutch West Indian (11.7%, a difference of 0.31%), Immigrants from Senegal (11.7%, a difference of 0.41%), and African (11.8%, a difference of 0.50%).
| Demographics | Rating | Rank | Family Poverty |
| Immigrants | Haiti | 0.0 /100 | #295 | Tragic 11.6% |
| Choctaw | 0.0 /100 | #296 | Tragic 11.6% |
| Creek | 0.0 /100 | #297 | Tragic 11.7% |
| Immigrants | Senegal | 0.0 /100 | #298 | Tragic 11.7% |
| Dutch West Indians | 0.0 /100 | #299 | Tragic 11.7% |
| Immigrants | Bangladesh | 0.0 /100 | #300 | Tragic 11.7% |
| Bahamians | 0.0 /100 | #301 | Tragic 11.7% |
| Guatemalans | 0.0 /100 | #302 | Tragic 11.7% |
| Africans | 0.0 /100 | #303 | Tragic 11.8% |
| Immigrants | Latin America | 0.0 /100 | #304 | Tragic 11.8% |
| Mexicans | 0.0 /100 | #305 | Tragic 11.8% |
| Cajuns | 0.0 /100 | #306 | Tragic 11.9% |
| Immigrants | Congo | 0.0 /100 | #307 | Tragic 11.9% |
| Seminole | 0.0 /100 | #308 | Tragic 11.9% |
| Hispanics or Latinos | 0.0 /100 | #309 | Tragic 12.0% |