Immigrants from Israel vs Mexican Family Poverty
COMPARE
Immigrants from Israel
Mexican
Family Poverty
Family Poverty Comparison
Immigrants from Israel
Mexicans
8.2%
FAMILY POVERTY
93.5/ 100
METRIC RATING
115th/ 347
METRIC RANK
11.8%
FAMILY POVERTY
0.0/ 100
METRIC RATING
305th/ 347
METRIC RANK
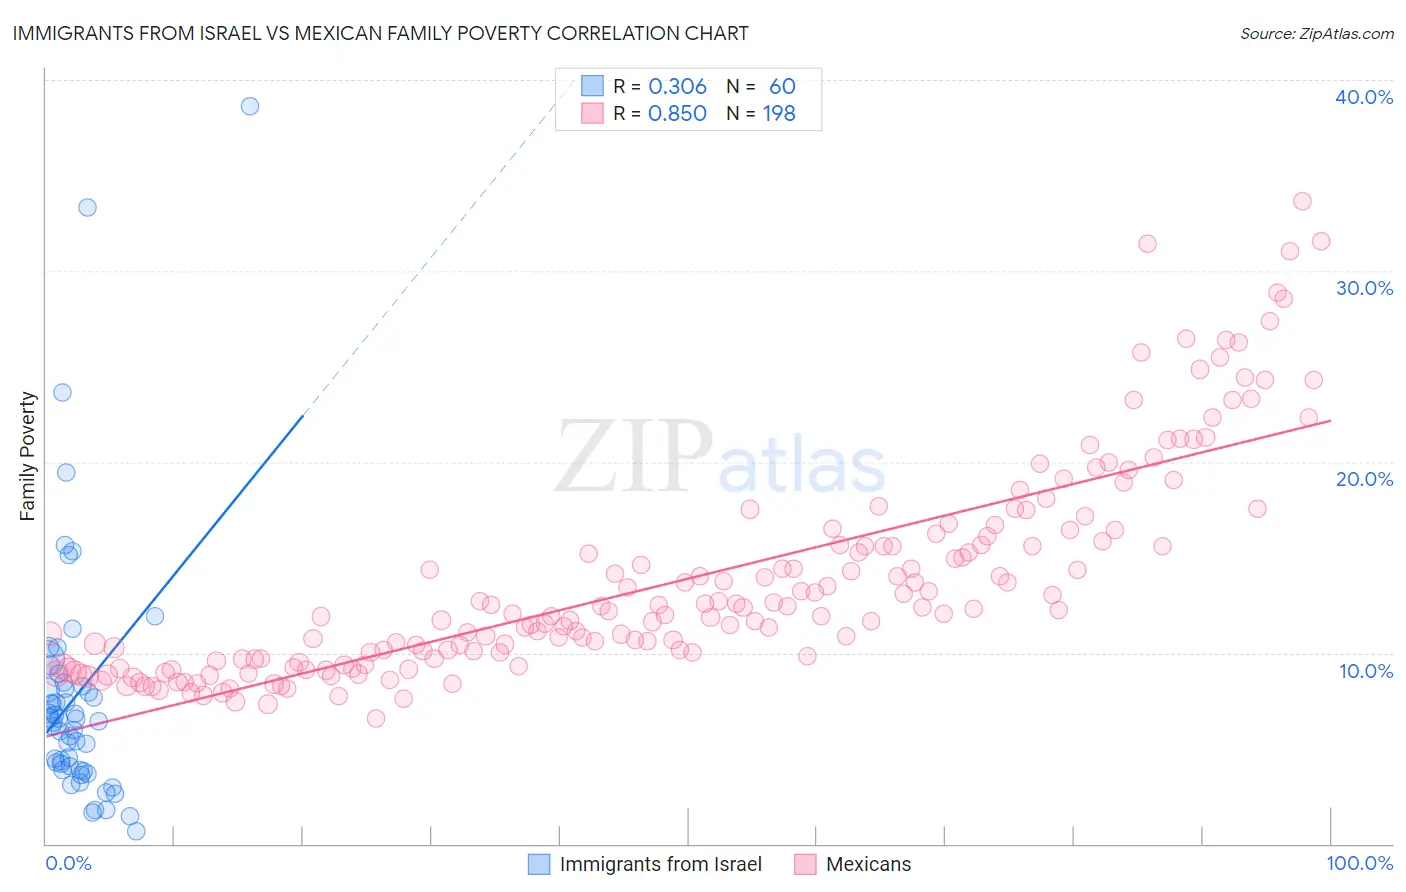
Immigrants from Israel vs Mexican Family Poverty Correlation Chart
The statistical analysis conducted on geographies consisting of 209,738,348 people shows a mild positive correlation between the proportion of Immigrants from Israel and poverty level among families in the United States with a correlation coefficient (R) of 0.306 and weighted average of 8.2%. Similarly, the statistical analysis conducted on geographies consisting of 561,352,455 people shows a very strong positive correlation between the proportion of Mexicans and poverty level among families in the United States with a correlation coefficient (R) of 0.850 and weighted average of 11.8%, a difference of 43.7%.
Family Poverty Correlation Summary
| Measurement | Immigrants from Israel | Mexican |
| Minimum | 0.67% | 6.6% |
| Maximum | 38.6% | 33.6% |
| Range | 37.9% | 27.1% |
| Mean | 7.8% | 13.8% |
| Median | 6.5% | 12.1% |
| Interquartile 25% (IQ1) | 4.0% | 9.7% |
| Interquartile 75% (IQ3) | 8.3% | 15.8% |
| Interquartile Range (IQR) | 4.4% | 6.2% |
| Standard Deviation (Sample) | 6.8% | 5.6% |
| Standard Deviation (Population) | 6.7% | 5.6% |
Similar Demographics by Family Poverty
Demographics Similar to Immigrants from Israel by Family Poverty
In terms of family poverty, the demographic groups most similar to Immigrants from Israel are South African (8.2%, a difference of 0.060%), Immigrants from Russia (8.2%, a difference of 0.13%), Immigrants from Western Europe (8.2%, a difference of 0.32%), Immigrants from Zimbabwe (8.2%, a difference of 0.34%), and French (8.3%, a difference of 0.39%).
| Demographics | Rating | Rank | Family Poverty |
| Basques | 94.9 /100 | #108 | Exceptional 8.1% |
| Jordanians | 94.8 /100 | #109 | Exceptional 8.2% |
| Romanians | 94.7 /100 | #110 | Exceptional 8.2% |
| Taiwanese | 94.6 /100 | #111 | Exceptional 8.2% |
| Immigrants | France | 94.4 /100 | #112 | Exceptional 8.2% |
| Canadians | 94.2 /100 | #113 | Exceptional 8.2% |
| Immigrants | Zimbabwe | 94.0 /100 | #114 | Exceptional 8.2% |
| Immigrants | Israel | 93.5 /100 | #115 | Exceptional 8.2% |
| South Africans | 93.4 /100 | #116 | Exceptional 8.2% |
| Immigrants | Russia | 93.2 /100 | #117 | Exceptional 8.2% |
| Immigrants | Western Europe | 92.9 /100 | #118 | Exceptional 8.2% |
| French | 92.8 /100 | #119 | Exceptional 8.3% |
| Immigrants | Egypt | 91.6 /100 | #120 | Exceptional 8.3% |
| Native Hawaiians | 91.3 /100 | #121 | Exceptional 8.3% |
| Paraguayans | 91.2 /100 | #122 | Exceptional 8.3% |
Demographics Similar to Mexicans by Family Poverty
In terms of family poverty, the demographic groups most similar to Mexicans are Immigrants from Latin America (11.8%, a difference of 0.18%), African (11.8%, a difference of 0.37%), Cajun (11.9%, a difference of 0.56%), Immigrants from Congo (11.9%, a difference of 0.67%), and Seminole (11.9%, a difference of 0.73%).
| Demographics | Rating | Rank | Family Poverty |
| Immigrants | Senegal | 0.0 /100 | #298 | Tragic 11.7% |
| Dutch West Indians | 0.0 /100 | #299 | Tragic 11.7% |
| Immigrants | Bangladesh | 0.0 /100 | #300 | Tragic 11.7% |
| Bahamians | 0.0 /100 | #301 | Tragic 11.7% |
| Guatemalans | 0.0 /100 | #302 | Tragic 11.7% |
| Africans | 0.0 /100 | #303 | Tragic 11.8% |
| Immigrants | Latin America | 0.0 /100 | #304 | Tragic 11.8% |
| Mexicans | 0.0 /100 | #305 | Tragic 11.8% |
| Cajuns | 0.0 /100 | #306 | Tragic 11.9% |
| Immigrants | Congo | 0.0 /100 | #307 | Tragic 11.9% |
| Seminole | 0.0 /100 | #308 | Tragic 11.9% |
| Hispanics or Latinos | 0.0 /100 | #309 | Tragic 12.0% |
| Immigrants | Guatemala | 0.0 /100 | #310 | Tragic 12.0% |
| Ute | 0.0 /100 | #311 | Tragic 12.1% |
| Immigrants | Central America | 0.0 /100 | #312 | Tragic 12.1% |