Indonesian vs Native/Alaskan Poverty
COMPARE
Indonesian
Native/Alaskan
Poverty
Poverty Comparison
Indonesians
Natives/Alaskans
15.1%
POVERTY
0.0/ 100
METRIC RATING
292nd/ 347
METRIC RANK
18.1%
POVERTY
0.0/ 100
METRIC RATING
332nd/ 347
METRIC RANK
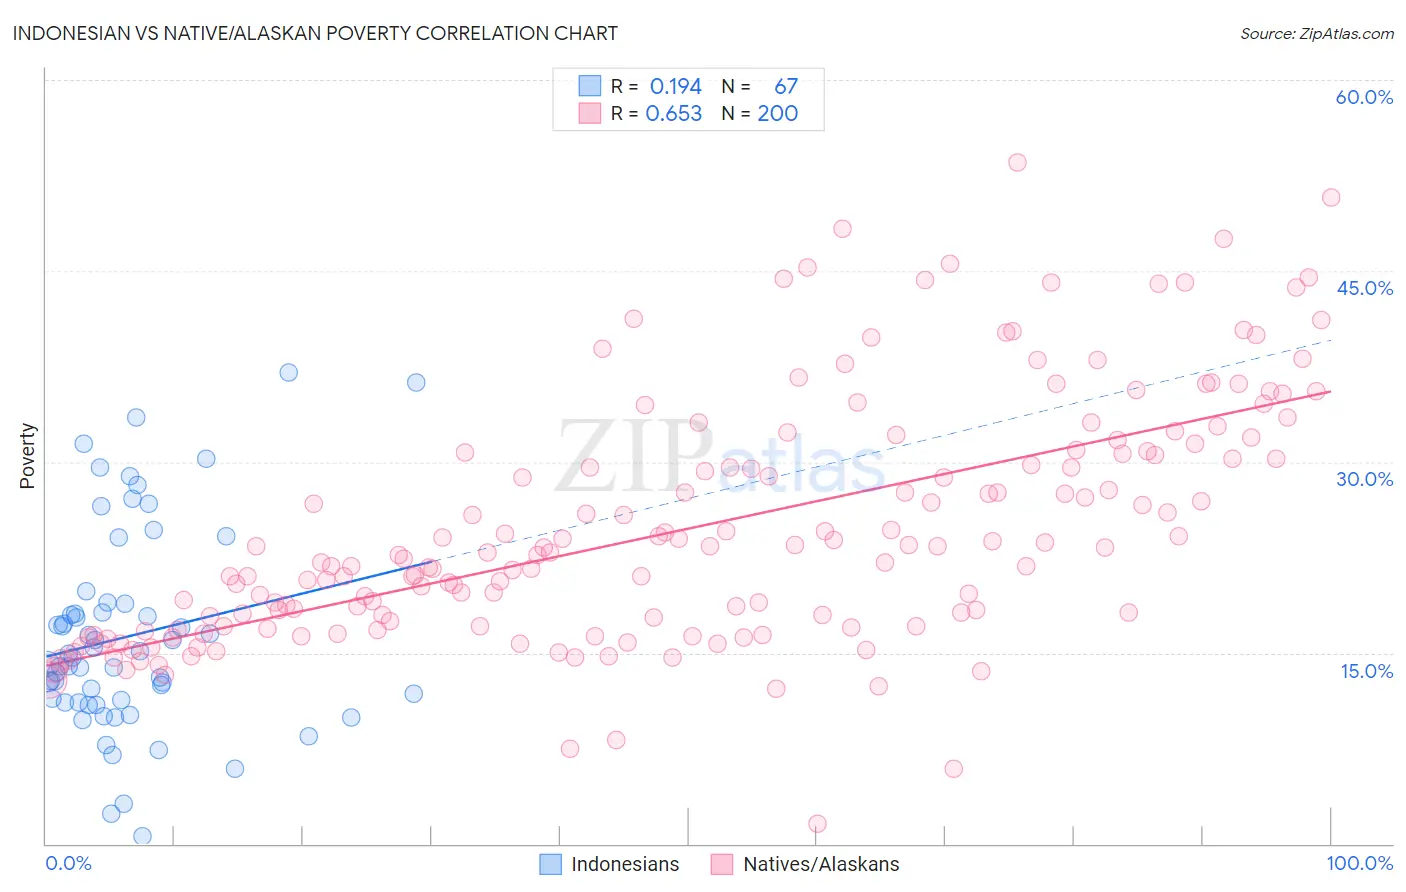
Indonesian vs Native/Alaskan Poverty Correlation Chart
The statistical analysis conducted on geographies consisting of 162,655,405 people shows a poor positive correlation between the proportion of Indonesians and poverty level in the United States with a correlation coefficient (R) of 0.194 and weighted average of 15.1%. Similarly, the statistical analysis conducted on geographies consisting of 512,638,915 people shows a significant positive correlation between the proportion of Natives/Alaskans and poverty level in the United States with a correlation coefficient (R) of 0.653 and weighted average of 18.1%, a difference of 19.4%.
Poverty Correlation Summary
| Measurement | Indonesian | Native/Alaskan |
| Minimum | 0.56% | 1.6% |
| Maximum | 37.0% | 53.5% |
| Range | 36.5% | 51.9% |
| Mean | 16.3% | 24.8% |
| Median | 14.6% | 22.8% |
| Interquartile 25% (IQ1) | 11.1% | 17.1% |
| Interquartile 75% (IQ3) | 18.9% | 30.7% |
| Interquartile Range (IQR) | 7.8% | 13.6% |
| Standard Deviation (Sample) | 7.9% | 9.6% |
| Standard Deviation (Population) | 7.9% | 9.5% |
Similar Demographics by Poverty
Demographics Similar to Indonesians by Poverty
In terms of poverty, the demographic groups most similar to Indonesians are Immigrants from Zaire (15.1%, a difference of 0.010%), Immigrants from Cabo Verde (15.1%, a difference of 0.050%), Mexican (15.1%, a difference of 0.18%), Immigrants from Belize (15.1%, a difference of 0.28%), and Yaqui (15.1%, a difference of 0.40%).
| Demographics | Rating | Rank | Poverty |
| Vietnamese | 0.0 /100 | #285 | Tragic 15.0% |
| Immigrants | Latin America | 0.0 /100 | #286 | Tragic 15.0% |
| Inupiat | 0.0 /100 | #287 | Tragic 15.1% |
| Yaqui | 0.0 /100 | #288 | Tragic 15.1% |
| Immigrants | Belize | 0.0 /100 | #289 | Tragic 15.1% |
| Mexicans | 0.0 /100 | #290 | Tragic 15.1% |
| Immigrants | Cabo Verde | 0.0 /100 | #291 | Tragic 15.1% |
| Indonesians | 0.0 /100 | #292 | Tragic 15.1% |
| Immigrants | Zaire | 0.0 /100 | #293 | Tragic 15.1% |
| Blackfeet | 0.0 /100 | #294 | Tragic 15.2% |
| Guatemalans | 0.0 /100 | #295 | Tragic 15.3% |
| Hispanics or Latinos | 0.0 /100 | #296 | Tragic 15.3% |
| Immigrants | Bangladesh | 0.0 /100 | #297 | Tragic 15.3% |
| Immigrants | Senegal | 0.0 /100 | #298 | Tragic 15.3% |
| Senegalese | 0.0 /100 | #299 | Tragic 15.3% |
Demographics Similar to Natives/Alaskans by Poverty
In terms of poverty, the demographic groups most similar to Natives/Alaskans are Immigrants from Dominican Republic (17.8%, a difference of 1.4%), Houma (18.4%, a difference of 2.0%), Apache (18.4%, a difference of 2.0%), Dominican (17.6%, a difference of 2.4%), and Black/African American (17.3%, a difference of 4.7%).
| Demographics | Rating | Rank | Poverty |
| Central American Indians | 0.0 /100 | #325 | Tragic 16.7% |
| Paiute | 0.0 /100 | #326 | Tragic 16.7% |
| Kiowa | 0.0 /100 | #327 | Tragic 16.8% |
| Ute | 0.0 /100 | #328 | Tragic 16.9% |
| Blacks/African Americans | 0.0 /100 | #329 | Tragic 17.3% |
| Dominicans | 0.0 /100 | #330 | Tragic 17.6% |
| Immigrants | Dominican Republic | 0.0 /100 | #331 | Tragic 17.8% |
| Natives/Alaskans | 0.0 /100 | #332 | Tragic 18.1% |
| Houma | 0.0 /100 | #333 | Tragic 18.4% |
| Apache | 0.0 /100 | #334 | Tragic 18.4% |
| Cheyenne | 0.0 /100 | #335 | Tragic 18.9% |
| Pueblo | 0.0 /100 | #336 | Tragic 19.4% |
| Sioux | 0.0 /100 | #337 | Tragic 19.8% |
| Yuman | 0.0 /100 | #338 | Tragic 20.2% |
| Crow | 0.0 /100 | #339 | Tragic 20.7% |