West Indian vs Immigrants from China Male Poverty
COMPARE
West Indian
Immigrants from China
Male Poverty
Male Poverty Comparison
West Indians
Immigrants from China
13.8%
MALE POVERTY
0.0/ 100
METRIC RATING
285th/ 347
METRIC RANK
10.7%
MALE POVERTY
87.1/ 100
METRIC RATING
120th/ 347
METRIC RANK
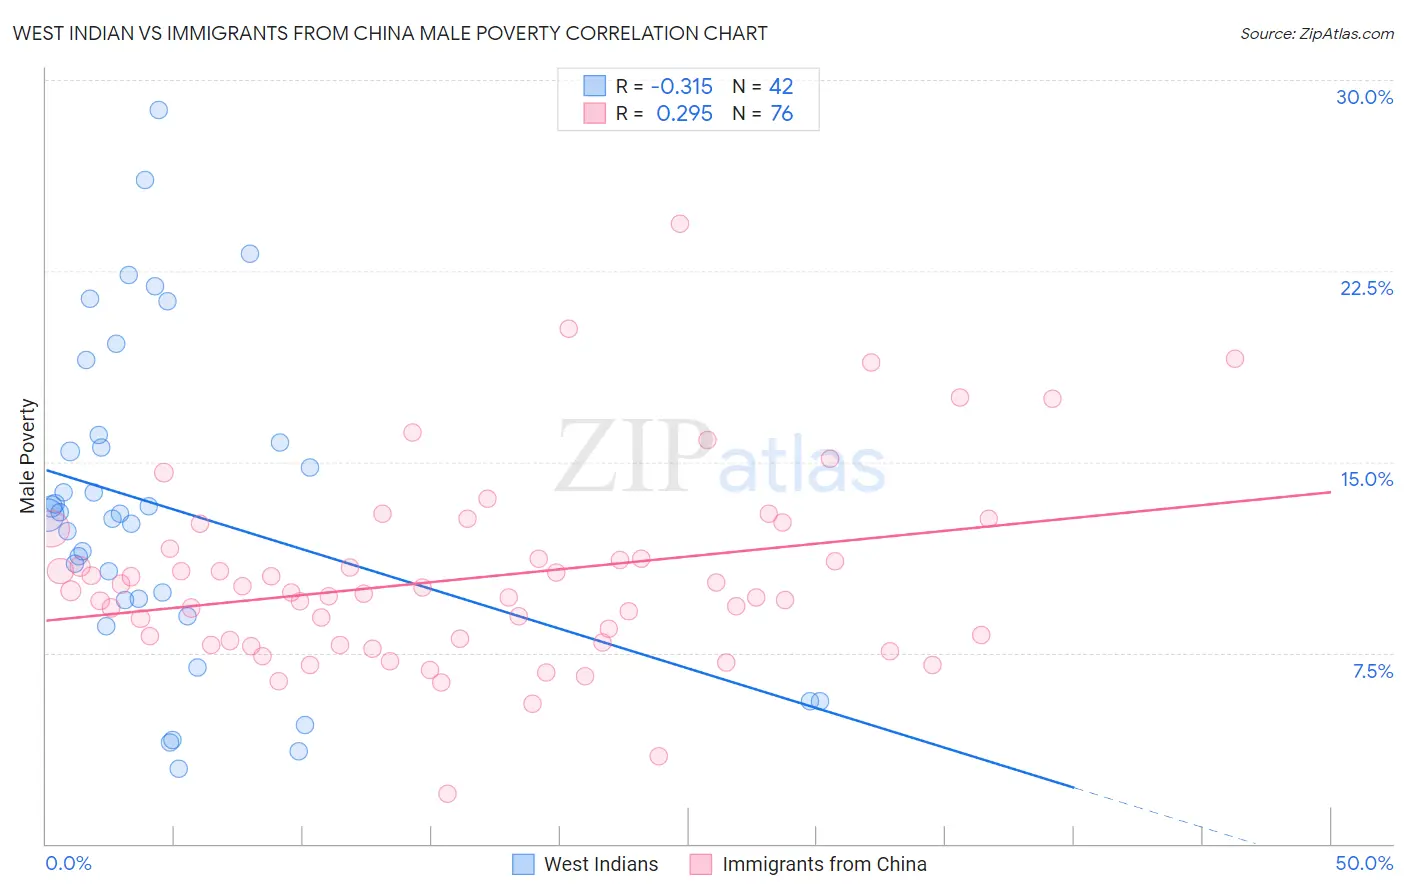
West Indian vs Immigrants from China Male Poverty Correlation Chart
The statistical analysis conducted on geographies consisting of 253,851,843 people shows a mild negative correlation between the proportion of West Indians and poverty level among males in the United States with a correlation coefficient (R) of -0.315 and weighted average of 13.8%. Similarly, the statistical analysis conducted on geographies consisting of 456,181,421 people shows a weak positive correlation between the proportion of Immigrants from China and poverty level among males in the United States with a correlation coefficient (R) of 0.295 and weighted average of 10.7%, a difference of 29.0%.
Male Poverty Correlation Summary
| Measurement | West Indian | Immigrants from China |
| Minimum | 3.0% | 1.9% |
| Maximum | 28.8% | 24.3% |
| Range | 25.8% | 22.4% |
| Mean | 13.2% | 10.4% |
| Median | 12.9% | 9.8% |
| Interquartile 25% (IQ1) | 9.6% | 7.9% |
| Interquartile 75% (IQ3) | 15.8% | 11.4% |
| Interquartile Range (IQR) | 6.2% | 3.4% |
| Standard Deviation (Sample) | 6.2% | 3.7% |
| Standard Deviation (Population) | 6.2% | 3.7% |
Similar Demographics by Male Poverty
Demographics Similar to West Indians by Male Poverty
In terms of male poverty, the demographic groups most similar to West Indians are Immigrants from Haiti (13.8%, a difference of 0.010%), Comanche (13.8%, a difference of 0.020%), Shoshone (13.8%, a difference of 0.030%), Immigrants from Barbados (13.8%, a difference of 0.050%), and Immigrants from St. Vincent and the Grenadines (13.8%, a difference of 0.22%).
| Demographics | Rating | Rank | Male Poverty |
| Belizeans | 0.0 /100 | #278 | Tragic 13.6% |
| Haitians | 0.0 /100 | #279 | Tragic 13.7% |
| Mexicans | 0.0 /100 | #280 | Tragic 13.7% |
| Yaqui | 0.0 /100 | #281 | Tragic 13.7% |
| Immigrants | Cabo Verde | 0.0 /100 | #282 | Tragic 13.7% |
| Comanche | 0.0 /100 | #283 | Tragic 13.8% |
| Immigrants | Haiti | 0.0 /100 | #284 | Tragic 13.8% |
| West Indians | 0.0 /100 | #285 | Tragic 13.8% |
| Shoshone | 0.0 /100 | #286 | Tragic 13.8% |
| Immigrants | Barbados | 0.0 /100 | #287 | Tragic 13.8% |
| Immigrants | St. Vincent and the Grenadines | 0.0 /100 | #288 | Tragic 13.8% |
| Guatemalans | 0.0 /100 | #289 | Tragic 13.8% |
| Immigrants | Zaire | 0.0 /100 | #290 | Tragic 13.8% |
| Vietnamese | 0.0 /100 | #291 | Tragic 13.8% |
| Indonesians | 0.0 /100 | #292 | Tragic 13.8% |
Demographics Similar to Immigrants from China by Male Poverty
In terms of male poverty, the demographic groups most similar to Immigrants from China are Peruvian (10.7%, a difference of 0.010%), Native Hawaiian (10.7%, a difference of 0.030%), South African (10.7%, a difference of 0.070%), Immigrants from Hungary (10.7%, a difference of 0.10%), and French (10.7%, a difference of 0.10%).
| Demographics | Rating | Rank | Male Poverty |
| Palestinians | 89.1 /100 | #113 | Excellent 10.6% |
| Immigrants | Brazil | 89.0 /100 | #114 | Excellent 10.6% |
| Immigrants | Russia | 88.6 /100 | #115 | Excellent 10.6% |
| Sri Lankans | 88.1 /100 | #116 | Excellent 10.6% |
| Immigrants | South Eastern Asia | 88.1 /100 | #117 | Excellent 10.6% |
| Okinawans | 87.6 /100 | #118 | Excellent 10.7% |
| Immigrants | Hungary | 87.6 /100 | #119 | Excellent 10.7% |
| Immigrants | China | 87.1 /100 | #120 | Excellent 10.7% |
| Peruvians | 87.1 /100 | #121 | Excellent 10.7% |
| Native Hawaiians | 87.0 /100 | #122 | Excellent 10.7% |
| South Africans | 86.8 /100 | #123 | Excellent 10.7% |
| French | 86.7 /100 | #124 | Excellent 10.7% |
| Immigrants | Norway | 86.0 /100 | #125 | Excellent 10.7% |
| Immigrants | Ukraine | 84.3 /100 | #126 | Excellent 10.7% |
| Puget Sound Salish | 84.3 /100 | #127 | Excellent 10.7% |