Immigrants from Hungary vs Immigrants from Micronesia Poverty
COMPARE
Immigrants from Hungary
Immigrants from Micronesia
Poverty
Poverty Comparison
Immigrants from Hungary
Immigrants from Micronesia
11.7%
POVERTY
88.6/ 100
METRIC RATING
123rd/ 347
METRIC RANK
13.4%
POVERTY
2.6/ 100
METRIC RATING
222nd/ 347
METRIC RANK
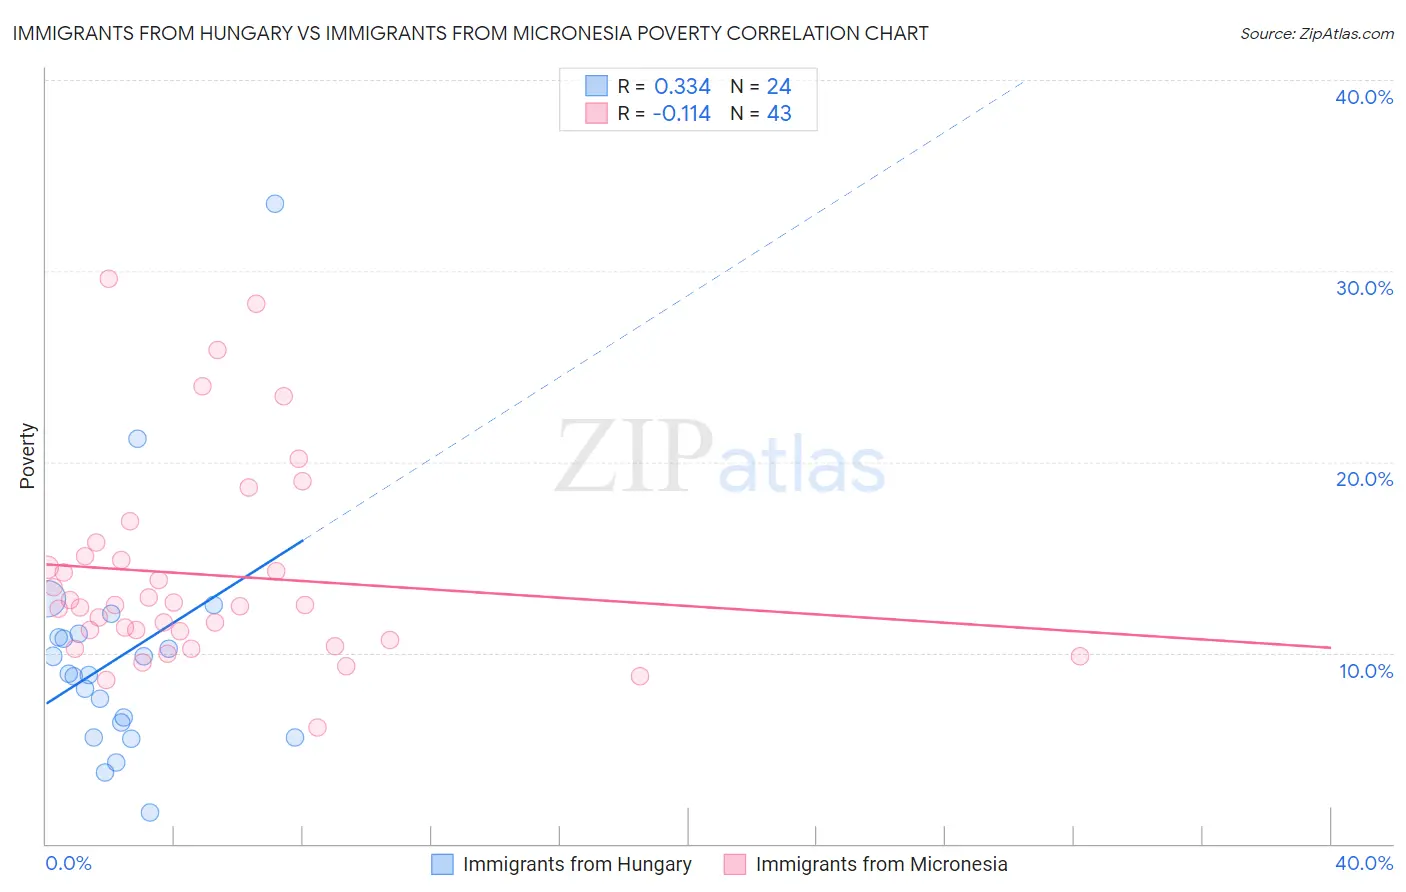
Immigrants from Hungary vs Immigrants from Micronesia Poverty Correlation Chart
The statistical analysis conducted on geographies consisting of 195,671,774 people shows a mild positive correlation between the proportion of Immigrants from Hungary and poverty level in the United States with a correlation coefficient (R) of 0.334 and weighted average of 11.7%. Similarly, the statistical analysis conducted on geographies consisting of 61,600,869 people shows a poor negative correlation between the proportion of Immigrants from Micronesia and poverty level in the United States with a correlation coefficient (R) of -0.114 and weighted average of 13.4%, a difference of 14.5%.
Poverty Correlation Summary
| Measurement | Immigrants from Hungary | Immigrants from Micronesia |
| Minimum | 1.6% | 6.1% |
| Maximum | 33.5% | 29.6% |
| Range | 31.9% | 23.5% |
| Mean | 9.8% | 14.1% |
| Median | 8.9% | 12.5% |
| Interquartile 25% (IQ1) | 6.0% | 10.7% |
| Interquartile 75% (IQ3) | 10.9% | 15.0% |
| Interquartile Range (IQR) | 4.9% | 4.4% |
| Standard Deviation (Sample) | 6.4% | 5.3% |
| Standard Deviation (Population) | 6.3% | 5.3% |
Similar Demographics by Poverty
Demographics Similar to Immigrants from Hungary by Poverty
In terms of poverty, the demographic groups most similar to Immigrants from Hungary are New Zealander (11.7%, a difference of 0.020%), Puget Sound Salish (11.7%, a difference of 0.020%), Soviet Union (11.7%, a difference of 0.070%), Immigrants from South Eastern Asia (11.7%, a difference of 0.080%), and Tlingit-Haida (11.7%, a difference of 0.090%).
| Demographics | Rating | Rank | Poverty |
| Immigrants | Russia | 89.7 /100 | #116 | Excellent 11.7% |
| Sri Lankans | 89.4 /100 | #117 | Excellent 11.7% |
| Argentineans | 89.1 /100 | #118 | Excellent 11.7% |
| Tlingit-Haida | 89.0 /100 | #119 | Excellent 11.7% |
| Immigrants | South Eastern Asia | 88.9 /100 | #120 | Excellent 11.7% |
| New Zealanders | 88.7 /100 | #121 | Excellent 11.7% |
| Puget Sound Salish | 88.7 /100 | #122 | Excellent 11.7% |
| Immigrants | Hungary | 88.6 /100 | #123 | Excellent 11.7% |
| Soviet Union | 88.4 /100 | #124 | Excellent 11.7% |
| Immigrants | Brazil | 88.2 /100 | #125 | Excellent 11.7% |
| Immigrants | Norway | 88.0 /100 | #126 | Excellent 11.7% |
| Immigrants | Argentina | 88.0 /100 | #127 | Excellent 11.7% |
| Immigrants | Israel | 87.4 /100 | #128 | Excellent 11.7% |
| South Africans | 87.0 /100 | #129 | Excellent 11.7% |
| Immigrants | Ukraine | 86.6 /100 | #130 | Excellent 11.8% |
Demographics Similar to Immigrants from Micronesia by Poverty
In terms of poverty, the demographic groups most similar to Immigrants from Micronesia are Alsatian (13.4%, a difference of 0.040%), Immigrants from Africa (13.4%, a difference of 0.040%), Immigrants from Eritrea (13.4%, a difference of 0.14%), American (13.4%, a difference of 0.24%), and Immigrants from Cambodia (13.4%, a difference of 0.33%).
| Demographics | Rating | Rank | Poverty |
| Japanese | 3.3 /100 | #215 | Tragic 13.3% |
| Immigrants | Nonimmigrants | 3.3 /100 | #216 | Tragic 13.3% |
| Immigrants | Uzbekistan | 3.2 /100 | #217 | Tragic 13.3% |
| Immigrants | Thailand | 3.1 /100 | #218 | Tragic 13.3% |
| Immigrants | Cambodia | 3.0 /100 | #219 | Tragic 13.4% |
| Americans | 2.9 /100 | #220 | Tragic 13.4% |
| Alsatians | 2.6 /100 | #221 | Tragic 13.4% |
| Immigrants | Micronesia | 2.6 /100 | #222 | Tragic 13.4% |
| Immigrants | Africa | 2.5 /100 | #223 | Tragic 13.4% |
| Immigrants | Eritrea | 2.4 /100 | #224 | Tragic 13.4% |
| German Russians | 2.2 /100 | #225 | Tragic 13.4% |
| Marshallese | 2.2 /100 | #226 | Tragic 13.4% |
| Alaska Natives | 2.1 /100 | #227 | Tragic 13.5% |
| Immigrants | Nigeria | 1.7 /100 | #228 | Tragic 13.5% |
| Osage | 1.5 /100 | #229 | Tragic 13.6% |