Immigrants from Hong Kong vs U.S. Virgin Islander Male Poverty
COMPARE
Immigrants from Hong Kong
U.S. Virgin Islander
Male Poverty
Male Poverty Comparison
Immigrants from Hong Kong
U.S. Virgin Islanders
9.6%
MALE POVERTY
99.7/ 100
METRIC RATING
19th/ 347
METRIC RANK
14.7%
MALE POVERTY
0.0/ 100
METRIC RATING
319th/ 347
METRIC RANK
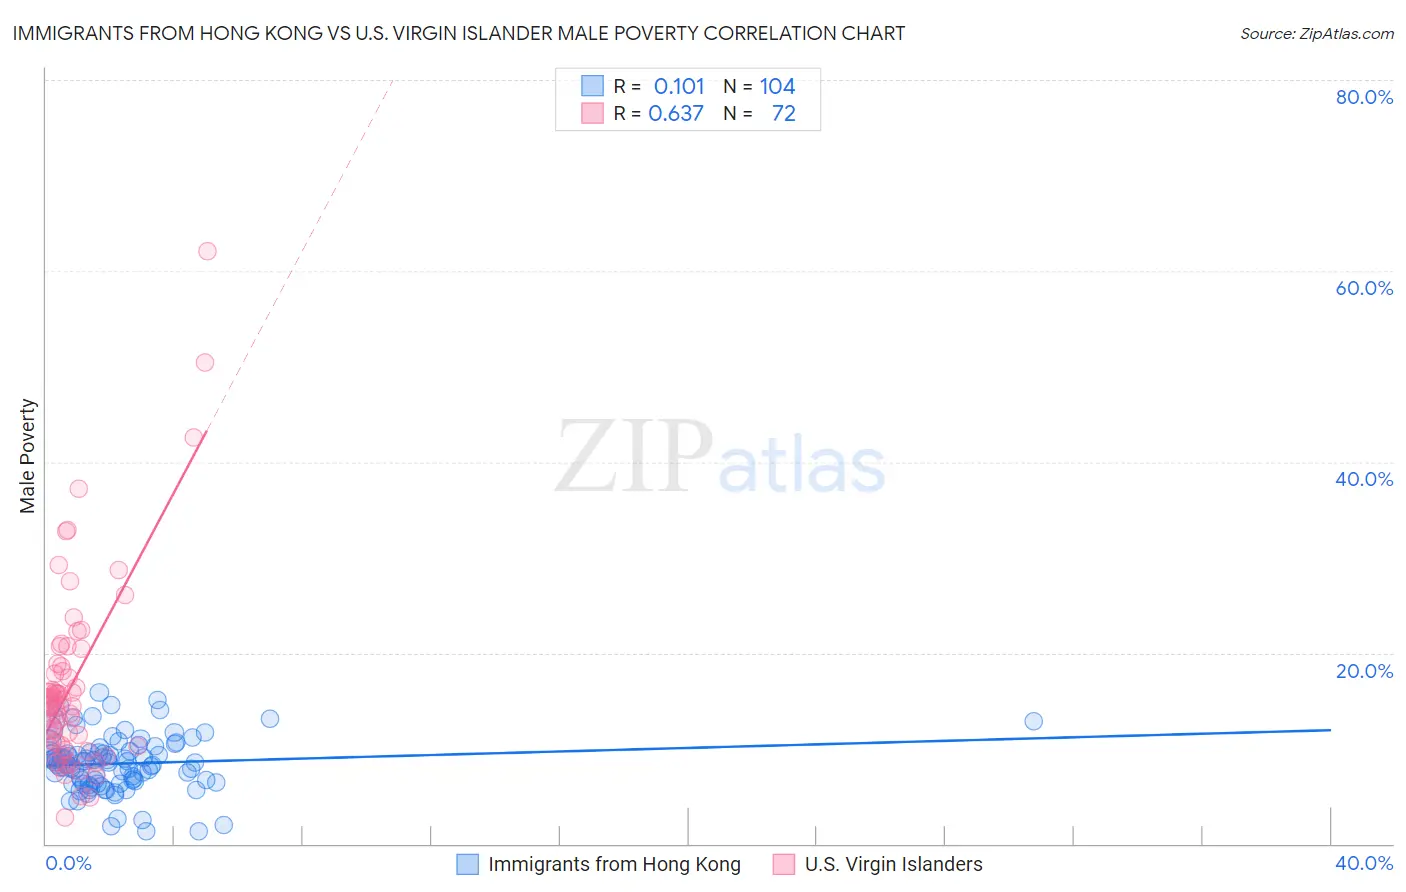
Immigrants from Hong Kong vs U.S. Virgin Islander Male Poverty Correlation Chart
The statistical analysis conducted on geographies consisting of 253,850,467 people shows a poor positive correlation between the proportion of Immigrants from Hong Kong and poverty level among males in the United States with a correlation coefficient (R) of 0.101 and weighted average of 9.6%. Similarly, the statistical analysis conducted on geographies consisting of 87,513,000 people shows a significant positive correlation between the proportion of U.S. Virgin Islanders and poverty level among males in the United States with a correlation coefficient (R) of 0.637 and weighted average of 14.7%, a difference of 53.9%.
Male Poverty Correlation Summary
| Measurement | Immigrants from Hong Kong | U.S. Virgin Islander |
| Minimum | 1.3% | 2.7% |
| Maximum | 15.8% | 62.0% |
| Range | 14.5% | 59.3% |
| Mean | 8.4% | 16.8% |
| Median | 8.6% | 14.9% |
| Interquartile 25% (IQ1) | 6.6% | 10.4% |
| Interquartile 75% (IQ3) | 9.6% | 18.7% |
| Interquartile Range (IQR) | 3.0% | 8.3% |
| Standard Deviation (Sample) | 2.9% | 10.1% |
| Standard Deviation (Population) | 2.9% | 10.0% |
Similar Demographics by Male Poverty
Demographics Similar to Immigrants from Hong Kong by Male Poverty
In terms of male poverty, the demographic groups most similar to Immigrants from Hong Kong are Latvian (9.6%, a difference of 0.10%), Lithuanian (9.5%, a difference of 0.18%), Norwegian (9.5%, a difference of 0.35%), Immigrants from Scotland (9.6%, a difference of 0.36%), and Luxembourger (9.5%, a difference of 0.48%).
| Demographics | Rating | Rank | Male Poverty |
| Immigrants | Bolivia | 99.9 /100 | #12 | Exceptional 9.4% |
| Immigrants | Lithuania | 99.9 /100 | #13 | Exceptional 9.4% |
| Immigrants | North Macedonia | 99.8 /100 | #14 | Exceptional 9.4% |
| Bhutanese | 99.8 /100 | #15 | Exceptional 9.5% |
| Luxembourgers | 99.8 /100 | #16 | Exceptional 9.5% |
| Norwegians | 99.8 /100 | #17 | Exceptional 9.5% |
| Lithuanians | 99.8 /100 | #18 | Exceptional 9.5% |
| Immigrants | Hong Kong | 99.7 /100 | #19 | Exceptional 9.6% |
| Latvians | 99.7 /100 | #20 | Exceptional 9.6% |
| Immigrants | Scotland | 99.7 /100 | #21 | Exceptional 9.6% |
| Croatians | 99.7 /100 | #22 | Exceptional 9.6% |
| Italians | 99.7 /100 | #23 | Exceptional 9.6% |
| Swedes | 99.7 /100 | #24 | Exceptional 9.6% |
| Eastern Europeans | 99.6 /100 | #25 | Exceptional 9.6% |
| Burmese | 99.6 /100 | #26 | Exceptional 9.7% |
Demographics Similar to U.S. Virgin Islanders by Male Poverty
In terms of male poverty, the demographic groups most similar to U.S. Virgin Islanders are Immigrants from Grenada (14.7%, a difference of 0.030%), Immigrants from Dominica (14.7%, a difference of 0.090%), Immigrants from Congo (14.7%, a difference of 0.090%), British West Indian (14.6%, a difference of 0.76%), and Chippewa (14.6%, a difference of 0.79%).
| Demographics | Rating | Rank | Male Poverty |
| Choctaw | 0.0 /100 | #312 | Tragic 14.4% |
| Immigrants | Somalia | 0.0 /100 | #313 | Tragic 14.6% |
| Immigrants | Honduras | 0.0 /100 | #314 | Tragic 14.6% |
| Chippewa | 0.0 /100 | #315 | Tragic 14.6% |
| British West Indians | 0.0 /100 | #316 | Tragic 14.6% |
| Immigrants | Dominica | 0.0 /100 | #317 | Tragic 14.7% |
| Immigrants | Grenada | 0.0 /100 | #318 | Tragic 14.7% |
| U.S. Virgin Islanders | 0.0 /100 | #319 | Tragic 14.7% |
| Immigrants | Congo | 0.0 /100 | #320 | Tragic 14.7% |
| Arapaho | 0.0 /100 | #321 | Tragic 15.1% |
| Kiowa | 0.0 /100 | #322 | Tragic 15.2% |
| Colville | 0.0 /100 | #323 | Tragic 15.2% |
| Menominee | 0.0 /100 | #324 | Tragic 15.3% |
| Yakama | 0.0 /100 | #325 | Tragic 15.3% |
| Central American Indians | 0.0 /100 | #326 | Tragic 15.3% |