Salvadoran vs U.S. Virgin Islander Male Poverty
COMPARE
Salvadoran
U.S. Virgin Islander
Male Poverty
Male Poverty Comparison
Salvadorans
U.S. Virgin Islanders
12.6%
MALE POVERTY
0.6/ 100
METRIC RATING
231st/ 347
METRIC RANK
14.7%
MALE POVERTY
0.0/ 100
METRIC RATING
319th/ 347
METRIC RANK
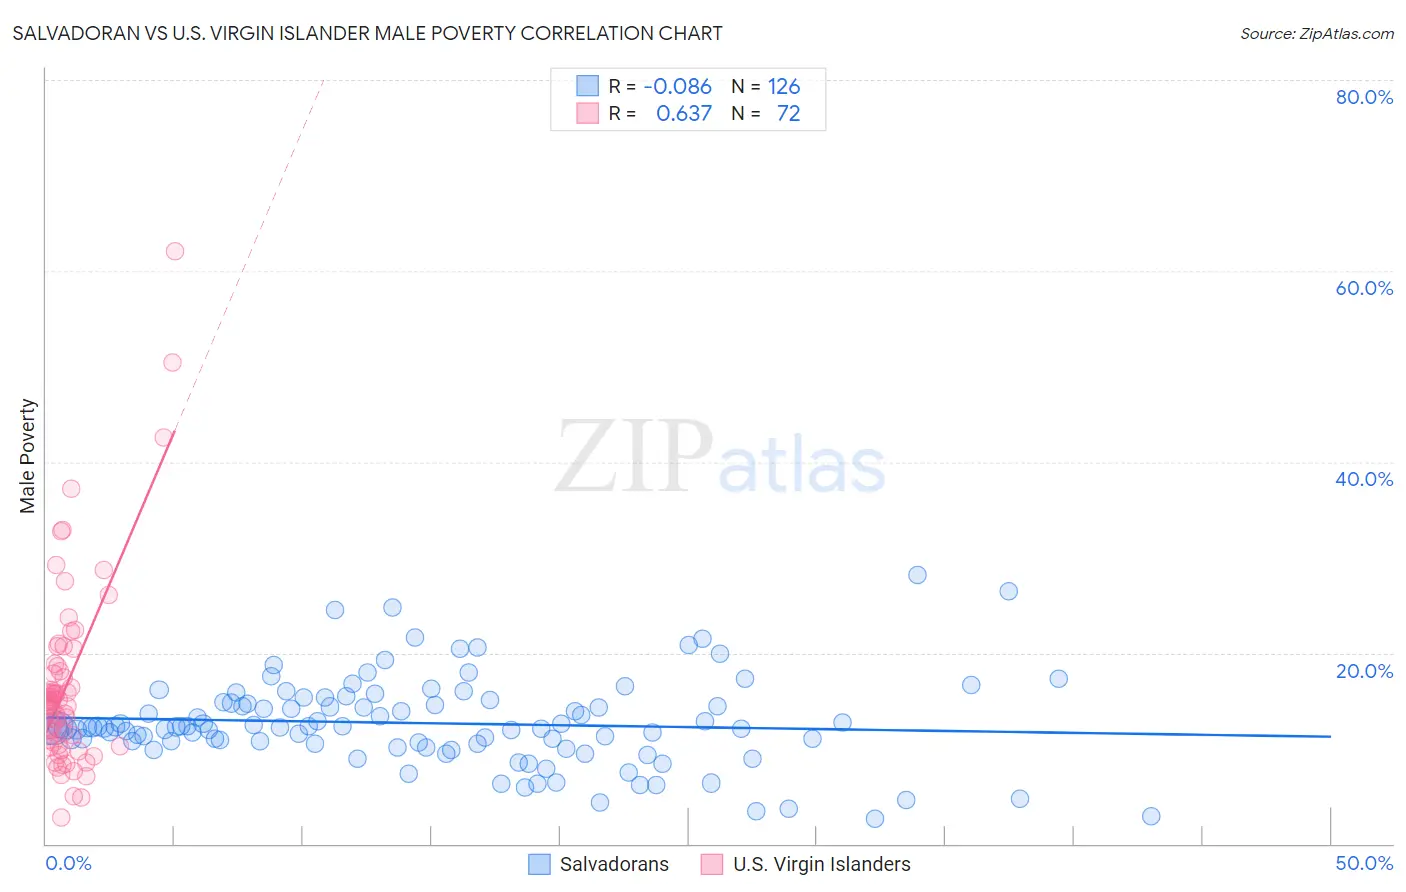
Salvadoran vs U.S. Virgin Islander Male Poverty Correlation Chart
The statistical analysis conducted on geographies consisting of 398,602,565 people shows a slight negative correlation between the proportion of Salvadorans and poverty level among males in the United States with a correlation coefficient (R) of -0.086 and weighted average of 12.6%. Similarly, the statistical analysis conducted on geographies consisting of 87,513,000 people shows a significant positive correlation between the proportion of U.S. Virgin Islanders and poverty level among males in the United States with a correlation coefficient (R) of 0.637 and weighted average of 14.7%, a difference of 17.0%.
Male Poverty Correlation Summary
| Measurement | Salvadoran | U.S. Virgin Islander |
| Minimum | 2.6% | 2.7% |
| Maximum | 28.2% | 62.0% |
| Range | 25.5% | 59.3% |
| Mean | 12.6% | 16.8% |
| Median | 12.2% | 14.9% |
| Interquartile 25% (IQ1) | 10.5% | 10.4% |
| Interquartile 75% (IQ3) | 14.7% | 18.7% |
| Interquartile Range (IQR) | 4.2% | 8.3% |
| Standard Deviation (Sample) | 4.6% | 10.1% |
| Standard Deviation (Population) | 4.6% | 10.0% |
Similar Demographics by Male Poverty
Demographics Similar to Salvadorans by Male Poverty
In terms of male poverty, the demographic groups most similar to Salvadorans are Nicaraguan (12.6%, a difference of 0.12%), Fijian (12.6%, a difference of 0.16%), Immigrants from Armenia (12.6%, a difference of 0.23%), Marshallese (12.5%, a difference of 0.56%), and Immigrants from Laos (12.6%, a difference of 0.59%).
| Demographics | Rating | Rank | Male Poverty |
| Immigrants | Nigeria | 1.6 /100 | #224 | Tragic 12.3% |
| Osage | 1.5 /100 | #225 | Tragic 12.3% |
| Nigerians | 1.4 /100 | #226 | Tragic 12.3% |
| Alaska Natives | 1.4 /100 | #227 | Tragic 12.4% |
| Alsatians | 1.3 /100 | #228 | Tragic 12.4% |
| Cubans | 1.3 /100 | #229 | Tragic 12.4% |
| Marshallese | 0.8 /100 | #230 | Tragic 12.5% |
| Salvadorans | 0.6 /100 | #231 | Tragic 12.6% |
| Nicaraguans | 0.6 /100 | #232 | Tragic 12.6% |
| Fijians | 0.6 /100 | #233 | Tragic 12.6% |
| Immigrants | Armenia | 0.6 /100 | #234 | Tragic 12.6% |
| Immigrants | Laos | 0.5 /100 | #235 | Tragic 12.6% |
| Immigrants | Saudi Arabia | 0.4 /100 | #236 | Tragic 12.7% |
| French American Indians | 0.4 /100 | #237 | Tragic 12.7% |
| Ecuadorians | 0.4 /100 | #238 | Tragic 12.7% |
Demographics Similar to U.S. Virgin Islanders by Male Poverty
In terms of male poverty, the demographic groups most similar to U.S. Virgin Islanders are Immigrants from Grenada (14.7%, a difference of 0.030%), Immigrants from Dominica (14.7%, a difference of 0.090%), Immigrants from Congo (14.7%, a difference of 0.090%), British West Indian (14.6%, a difference of 0.76%), and Chippewa (14.6%, a difference of 0.79%).
| Demographics | Rating | Rank | Male Poverty |
| Choctaw | 0.0 /100 | #312 | Tragic 14.4% |
| Immigrants | Somalia | 0.0 /100 | #313 | Tragic 14.6% |
| Immigrants | Honduras | 0.0 /100 | #314 | Tragic 14.6% |
| Chippewa | 0.0 /100 | #315 | Tragic 14.6% |
| British West Indians | 0.0 /100 | #316 | Tragic 14.6% |
| Immigrants | Dominica | 0.0 /100 | #317 | Tragic 14.7% |
| Immigrants | Grenada | 0.0 /100 | #318 | Tragic 14.7% |
| U.S. Virgin Islanders | 0.0 /100 | #319 | Tragic 14.7% |
| Immigrants | Congo | 0.0 /100 | #320 | Tragic 14.7% |
| Arapaho | 0.0 /100 | #321 | Tragic 15.1% |
| Kiowa | 0.0 /100 | #322 | Tragic 15.2% |
| Colville | 0.0 /100 | #323 | Tragic 15.2% |
| Menominee | 0.0 /100 | #324 | Tragic 15.3% |
| Yakama | 0.0 /100 | #325 | Tragic 15.3% |
| Central American Indians | 0.0 /100 | #326 | Tragic 15.3% |