Immigrants from Hong Kong vs French Male Poverty
COMPARE
Immigrants from Hong Kong
French
Male Poverty
Male Poverty Comparison
Immigrants from Hong Kong
French
9.6%
MALE POVERTY
99.7/ 100
METRIC RATING
19th/ 347
METRIC RANK
10.7%
MALE POVERTY
86.7/ 100
METRIC RATING
124th/ 347
METRIC RANK
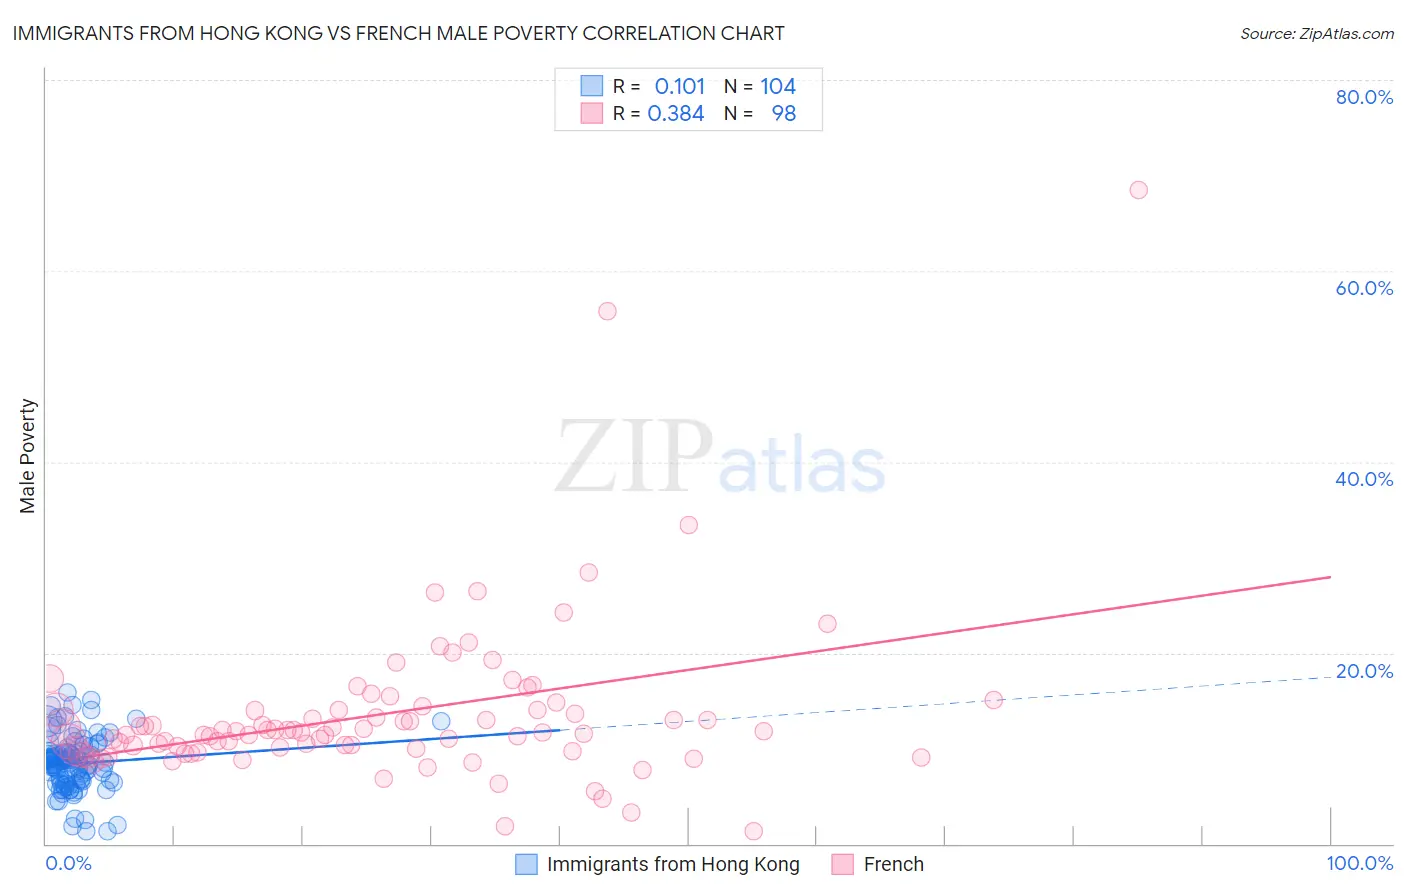
Immigrants from Hong Kong vs French Male Poverty Correlation Chart
The statistical analysis conducted on geographies consisting of 253,850,467 people shows a poor positive correlation between the proportion of Immigrants from Hong Kong and poverty level among males in the United States with a correlation coefficient (R) of 0.101 and weighted average of 9.6%. Similarly, the statistical analysis conducted on geographies consisting of 570,714,674 people shows a mild positive correlation between the proportion of French and poverty level among males in the United States with a correlation coefficient (R) of 0.384 and weighted average of 10.7%, a difference of 11.7%.
Male Poverty Correlation Summary
| Measurement | Immigrants from Hong Kong | French |
| Minimum | 1.3% | 1.3% |
| Maximum | 15.8% | 68.4% |
| Range | 14.5% | 67.2% |
| Mean | 8.4% | 13.6% |
| Median | 8.6% | 11.7% |
| Interquartile 25% (IQ1) | 6.6% | 9.9% |
| Interquartile 75% (IQ3) | 9.6% | 14.0% |
| Interquartile Range (IQR) | 3.0% | 4.1% |
| Standard Deviation (Sample) | 2.9% | 8.8% |
| Standard Deviation (Population) | 2.9% | 8.7% |
Similar Demographics by Male Poverty
Demographics Similar to Immigrants from Hong Kong by Male Poverty
In terms of male poverty, the demographic groups most similar to Immigrants from Hong Kong are Latvian (9.6%, a difference of 0.10%), Lithuanian (9.5%, a difference of 0.18%), Norwegian (9.5%, a difference of 0.35%), Immigrants from Scotland (9.6%, a difference of 0.36%), and Luxembourger (9.5%, a difference of 0.48%).
| Demographics | Rating | Rank | Male Poverty |
| Immigrants | Bolivia | 99.9 /100 | #12 | Exceptional 9.4% |
| Immigrants | Lithuania | 99.9 /100 | #13 | Exceptional 9.4% |
| Immigrants | North Macedonia | 99.8 /100 | #14 | Exceptional 9.4% |
| Bhutanese | 99.8 /100 | #15 | Exceptional 9.5% |
| Luxembourgers | 99.8 /100 | #16 | Exceptional 9.5% |
| Norwegians | 99.8 /100 | #17 | Exceptional 9.5% |
| Lithuanians | 99.8 /100 | #18 | Exceptional 9.5% |
| Immigrants | Hong Kong | 99.7 /100 | #19 | Exceptional 9.6% |
| Latvians | 99.7 /100 | #20 | Exceptional 9.6% |
| Immigrants | Scotland | 99.7 /100 | #21 | Exceptional 9.6% |
| Croatians | 99.7 /100 | #22 | Exceptional 9.6% |
| Italians | 99.7 /100 | #23 | Exceptional 9.6% |
| Swedes | 99.7 /100 | #24 | Exceptional 9.6% |
| Eastern Europeans | 99.6 /100 | #25 | Exceptional 9.6% |
| Burmese | 99.6 /100 | #26 | Exceptional 9.7% |
Demographics Similar to French by Male Poverty
In terms of male poverty, the demographic groups most similar to French are South African (10.7%, a difference of 0.030%), Native Hawaiian (10.7%, a difference of 0.070%), Peruvian (10.7%, a difference of 0.080%), Immigrants from China (10.7%, a difference of 0.10%), and Immigrants from Norway (10.7%, a difference of 0.15%).
| Demographics | Rating | Rank | Male Poverty |
| Immigrants | South Eastern Asia | 88.1 /100 | #117 | Excellent 10.6% |
| Okinawans | 87.6 /100 | #118 | Excellent 10.7% |
| Immigrants | Hungary | 87.6 /100 | #119 | Excellent 10.7% |
| Immigrants | China | 87.1 /100 | #120 | Excellent 10.7% |
| Peruvians | 87.1 /100 | #121 | Excellent 10.7% |
| Native Hawaiians | 87.0 /100 | #122 | Excellent 10.7% |
| South Africans | 86.8 /100 | #123 | Excellent 10.7% |
| French | 86.7 /100 | #124 | Excellent 10.7% |
| Immigrants | Norway | 86.0 /100 | #125 | Excellent 10.7% |
| Immigrants | Ukraine | 84.3 /100 | #126 | Excellent 10.7% |
| Puget Sound Salish | 84.3 /100 | #127 | Excellent 10.7% |
| Immigrants | Western Europe | 84.2 /100 | #128 | Excellent 10.7% |
| Immigrants | Peru | 84.1 /100 | #129 | Excellent 10.7% |
| Chileans | 83.9 /100 | #130 | Excellent 10.7% |
| Immigrants | Belarus | 83.3 /100 | #131 | Excellent 10.7% |