Immigrants from Mexico vs U.S. Virgin Islander Male Poverty
COMPARE
Immigrants from Mexico
U.S. Virgin Islander
Male Poverty
Male Poverty Comparison
Immigrants from Mexico
U.S. Virgin Islanders
14.0%
MALE POVERTY
0.0/ 100
METRIC RATING
300th/ 347
METRIC RANK
14.7%
MALE POVERTY
0.0/ 100
METRIC RATING
319th/ 347
METRIC RANK
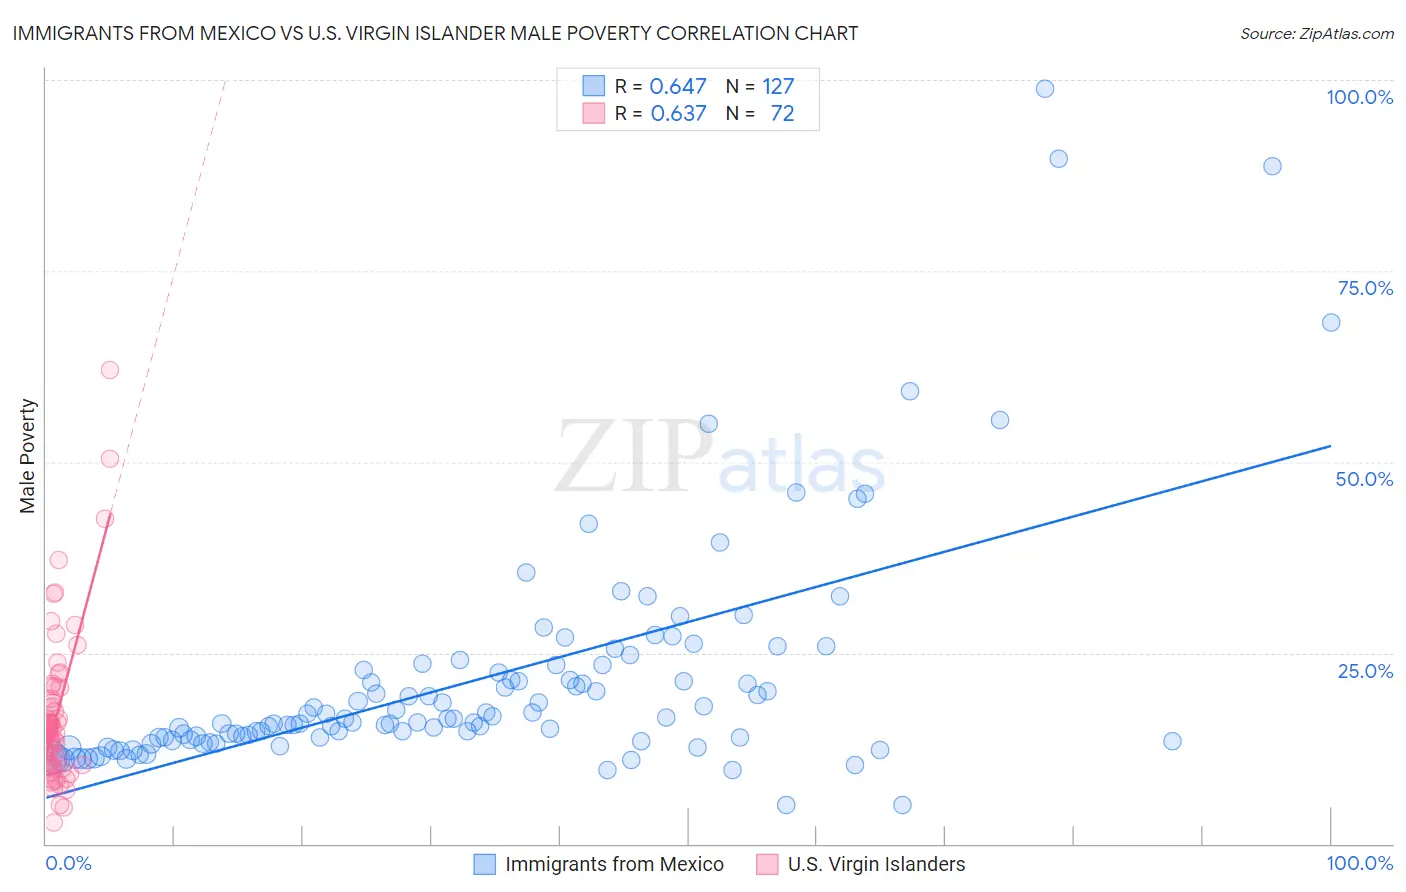
Immigrants from Mexico vs U.S. Virgin Islander Male Poverty Correlation Chart
The statistical analysis conducted on geographies consisting of 513,064,381 people shows a significant positive correlation between the proportion of Immigrants from Mexico and poverty level among males in the United States with a correlation coefficient (R) of 0.647 and weighted average of 14.0%. Similarly, the statistical analysis conducted on geographies consisting of 87,513,000 people shows a significant positive correlation between the proportion of U.S. Virgin Islanders and poverty level among males in the United States with a correlation coefficient (R) of 0.637 and weighted average of 14.7%, a difference of 4.8%.
Male Poverty Correlation Summary
| Measurement | Immigrants from Mexico | U.S. Virgin Islander |
| Minimum | 5.0% | 2.7% |
| Maximum | 98.8% | 62.0% |
| Range | 93.8% | 59.3% |
| Mean | 21.4% | 16.8% |
| Median | 15.9% | 14.9% |
| Interquartile 25% (IQ1) | 13.5% | 10.4% |
| Interquartile 75% (IQ3) | 22.7% | 18.7% |
| Interquartile Range (IQR) | 9.2% | 8.3% |
| Standard Deviation (Sample) | 15.3% | 10.1% |
| Standard Deviation (Population) | 15.2% | 10.0% |
Demographics Similar to Immigrants from Mexico and U.S. Virgin Islanders by Male Poverty
In terms of male poverty, the demographic groups most similar to Immigrants from Mexico are Immigrants from Senegal (14.0%, a difference of 0.070%), Immigrants from Guatemala (14.0%, a difference of 0.12%), Immigrants from Caribbean (14.0%, a difference of 0.13%), Bahamian (14.1%, a difference of 0.17%), and Senegalese (14.1%, a difference of 0.27%). Similarly, the demographic groups most similar to U.S. Virgin Islanders are Immigrants from Grenada (14.7%, a difference of 0.030%), Immigrants from Dominica (14.7%, a difference of 0.090%), British West Indian (14.6%, a difference of 0.76%), Chippewa (14.6%, a difference of 0.79%), and Immigrants from Honduras (14.6%, a difference of 0.87%).
| Demographics | Rating | Rank | Male Poverty |
| Immigrants | Guatemala | 0.0 /100 | #299 | Tragic 14.0% |
| Immigrants | Mexico | 0.0 /100 | #300 | Tragic 14.0% |
| Immigrants | Senegal | 0.0 /100 | #301 | Tragic 14.0% |
| Immigrants | Caribbean | 0.0 /100 | #302 | Tragic 14.0% |
| Bahamians | 0.0 /100 | #303 | Tragic 14.1% |
| Senegalese | 0.0 /100 | #304 | Tragic 14.1% |
| Immigrants | Bangladesh | 0.0 /100 | #305 | Tragic 14.1% |
| Creek | 0.0 /100 | #306 | Tragic 14.1% |
| Dutch West Indians | 0.0 /100 | #307 | Tragic 14.2% |
| Africans | 0.0 /100 | #308 | Tragic 14.2% |
| Somalis | 0.0 /100 | #309 | Tragic 14.3% |
| Seminole | 0.0 /100 | #310 | Tragic 14.3% |
| Hondurans | 0.0 /100 | #311 | Tragic 14.3% |
| Choctaw | 0.0 /100 | #312 | Tragic 14.4% |
| Immigrants | Somalia | 0.0 /100 | #313 | Tragic 14.6% |
| Immigrants | Honduras | 0.0 /100 | #314 | Tragic 14.6% |
| Chippewa | 0.0 /100 | #315 | Tragic 14.6% |
| British West Indians | 0.0 /100 | #316 | Tragic 14.6% |
| Immigrants | Dominica | 0.0 /100 | #317 | Tragic 14.7% |
| Immigrants | Grenada | 0.0 /100 | #318 | Tragic 14.7% |
| U.S. Virgin Islanders | 0.0 /100 | #319 | Tragic 14.7% |